
UBiBot Logo
UBiBot Logo
  • UBiBot Logo
  • Home
  • Products

    NEW

  • Pricing
  • Support
  • About Us
  • Download
  • magnifying-glass  Search
  • magnifying-glass header-close
  • Sign in Sign in
    Public Web Console Public Web Console
    On-Premises App Center On-Premises App Center
  • Home
  • Products

    NEW

  • Pricing
  • Support
  • About us
  • Download
  •  Public Web Console
  •  On-Premises App Center
  • Where to Buy

Learn Hub

Explore Knowledge Academic Research In-depth Tech

Share

LinkedIn

Facebook

X (Twitter)

Newsletter Signup

Table of contents

    Harbin Institute of Technology Uses UbiBot Sensors to Monitor Residential Indoor Temperature for Overheating and Shading Analysis

    Research Overview

    Paper Title Temperature-humidity evolution and radon exhalation mechanism of red clay-bentonite covering layer in uranium mill tailings pond
    Publisher Springer Nature
    Journey Scientific Reports
    Publish Time January 2024
    Authors / Institutions Chao Xie, Wenjun Lu, Hong Wang, Xiangshuai Wang, and Tao Yu; University of South China; Key Laboratory of Advanced Nuclear Energy Technology Design and Safety, Ministry of Education
    UbiBot Product UbiBot GS1 industrial temperature and humidity recorder
    Data Collected Temperature and humidity of the uranium mill tailings pond cover layer
    Sampling Frequency Continuous temperature and humidity monitoring; radon concentration was sampled every 10 minutes during each 3-hour measurement period, and corresponding temperature and humidity data were extracted at the same time
    Research Period Two cover-layer models were placed under the same natural outdoor environment for 7 days; five radon measurement periods were used for comparative analysis
    Application Scenario Uranium mill tailings pond remediation, cover-layer temperature and humidity monitoring, radon exhalation mechanism analysis, red clay-bentonite cover-layer performance evaluation
    Original Link https://doi.org/10.1038/s41598-023-50733-w

    Research Background: What Problem Did This Study Address?

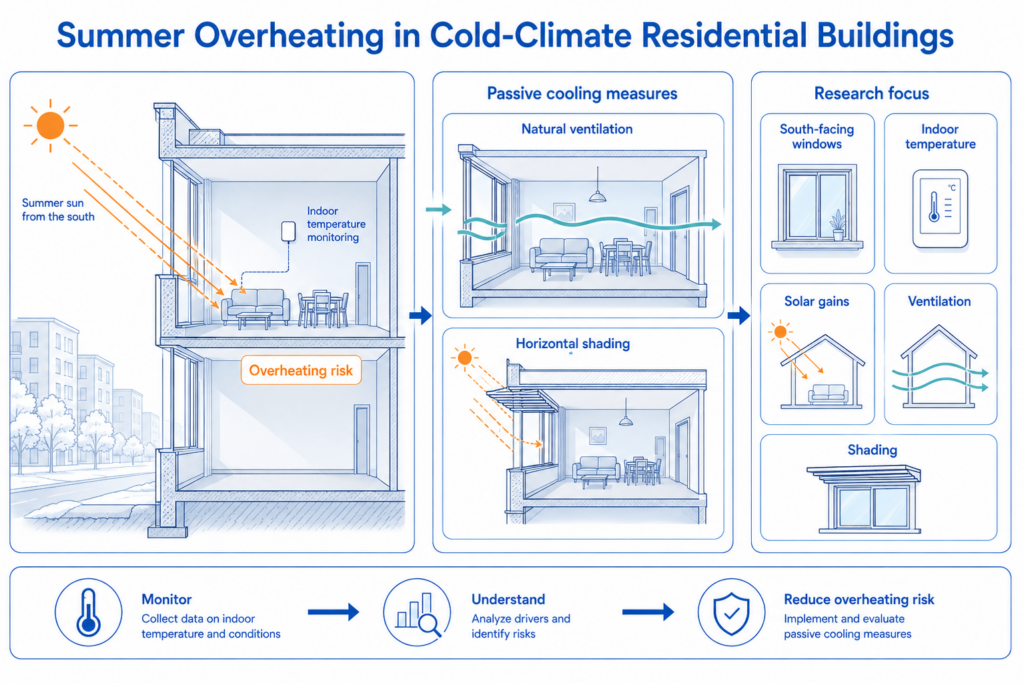
    Residential buildings in China’s severe cold and cold regions have traditionally been designed around winter heating performance. Local building codes mainly emphasise insulation, airtightness, and heating-energy reduction because these regions experience long and cold winters. However, with global warming and more frequent summer heat events, buildings that are optimised for retaining heat in winter may also face increased overheating risk in summer.

    The study focused on a policy and design gap. Current standards in these climate regions generally assume that summer overheating is not a major concern. As a result, there are limited requirements for summer shading, overheating assessment, or passive heat-protection strategies, except for limited recommendations in cold region 2B.

    The researchers investigated whether naturally ventilated residential buildings in Yichun, Harbin, Shenyang, Dalian, and Beijing experience summer overheating, and whether external horizontal shading devices can reduce overheating without causing excessive annual energy penalties. The study used IESVE building simulation to model an 18-storey reinforced concrete residential building and evaluate indoor operative temperature and energy consumption under different shading designs.

    UbiBot sensors were used in the empirical validation stage. The research team monitored indoor temperature in a real dwelling in Shenyang and compared measured data with simulated results. These measured data helped validate the simulation model before the model was used to analyse overheating and shading strategies across the five representative cities.

    The Specific Role of  UbiBot indoor temperature monitoring

    In this study, UbiBot sensors were used to collect real indoor temperature data for validating the IESVE simulation model. The paper does not state that UbiBot itself proved the effectiveness of horizontal shading. Instead, the researchers used UbiBot-generated field measurements as empirical evidence to check whether the simulation model could reasonably reproduce real indoor thermal conditions.
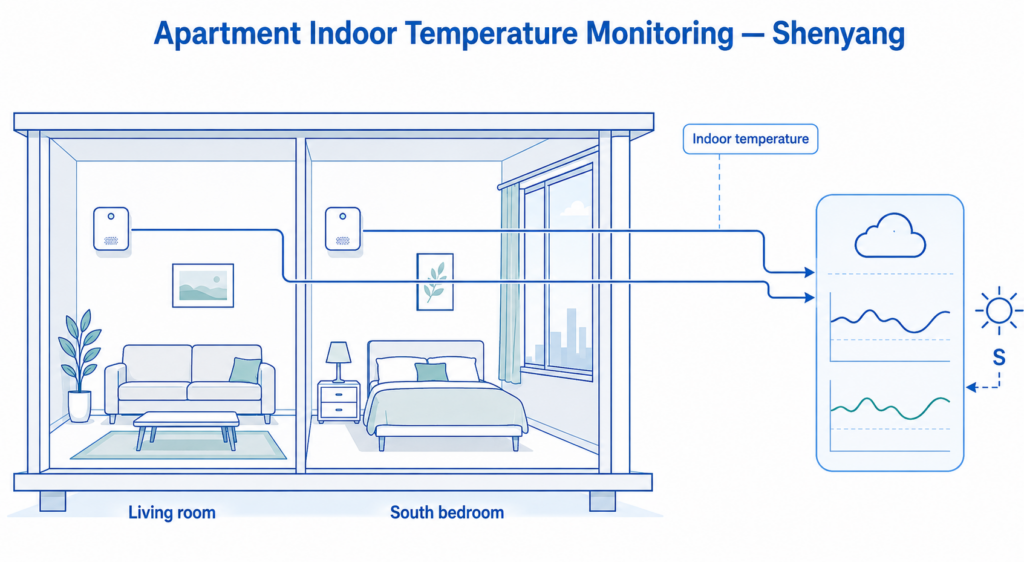
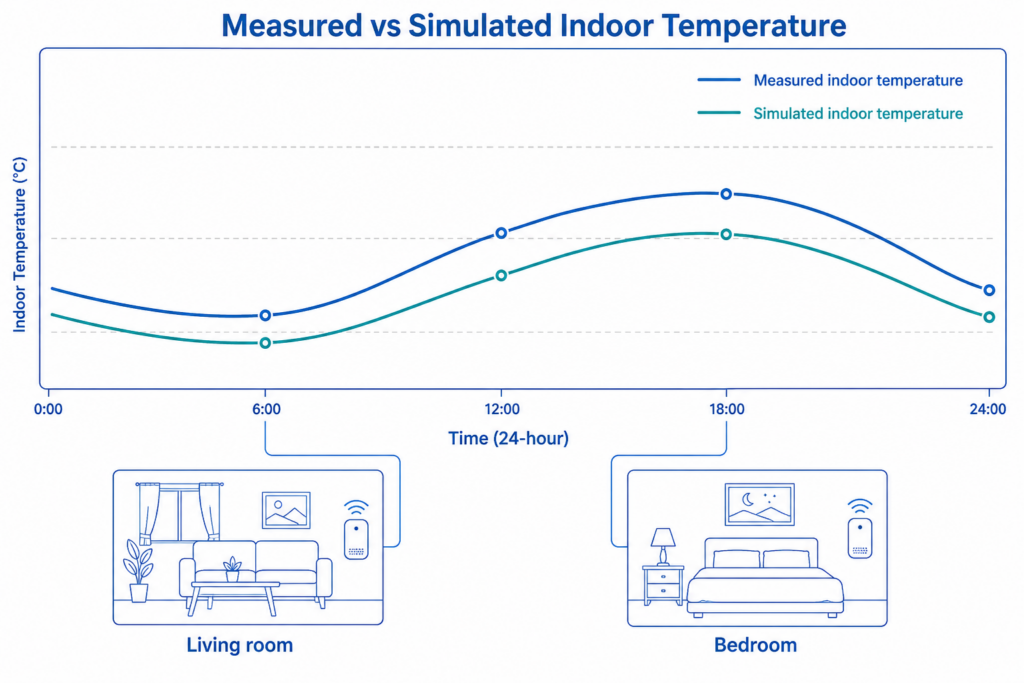
    The monitoring was conducted in a residential dwelling in Shenyang, China. Sensors were placed on the wall of the living room and the bedroom. According to the sensor-position diagram in the paper, one sensor was installed in the living room and another was installed in the south bedroom. This placement allowed the researchers to collect room-level indoor temperature data from the same types of spaces later analysed in the simulation: the living room and south-facing bedroom.

    The monitored period was from May 1 to September 30, 2021. The paper states that the measured data contained hourly indoor temperature values during this period. These hourly temperature data were used together with local meteorological data from the same period to validate the IESVE model.

    The paper describes the UbiBot sensor as having a temperature measurement range from 10 °C to 55 °C and an accuracy of ±0.3 °C for the validation section. In the sensor-parameter table, the device is also described with a UB-DT-P1 (DS18B20) external sensor, Wi-Fi network connection, temperature range of −20 °C to 60 °C, humidity range of 10–90%, and illumination range of 0.01–83 K lux. However, in the model validation workflow, the key dataset used was indoor temperature.

    UbiBot  UB-DT-P1 (DS18B20) external sensor

    The UbiBot data were used for model validation, not experimental control. The researchers selected measured and simulated temperature data at 6 a.m., 12 a.m., 6 p.m., and 12 p.m. each day and calculated Pearson correlation coefficients between measured and simulated results. The overall correlation coefficients were 0.7232 for the living room and 0.7029 for the bedroom, which the authors interpreted as showing strong consistency between simulation and field measurement.

    In practical terms, UbiBot provided the real indoor thermal dataset that supported the reliability of the simulation. Once validated, the simulation model was then used to test overheating duration, horizontal shading dimensions, solar gain reduction, and annual energy-consumption changes across five climate sub-regions.

    Research Methods and Data Collection Approach

    The study combined field monitoring, building simulation, overheating assessment, and shading-parameter comparison.

    First, the researchers selected five representative cities from China’s severe cold and cold climate regions: Yichun, Harbin, Shenyang, Dalian, and Beijing. These cities corresponded to severe cold 1A, severe cold 1B, severe cold 1C, cold 2A, and cold 2B climate sub-regions.
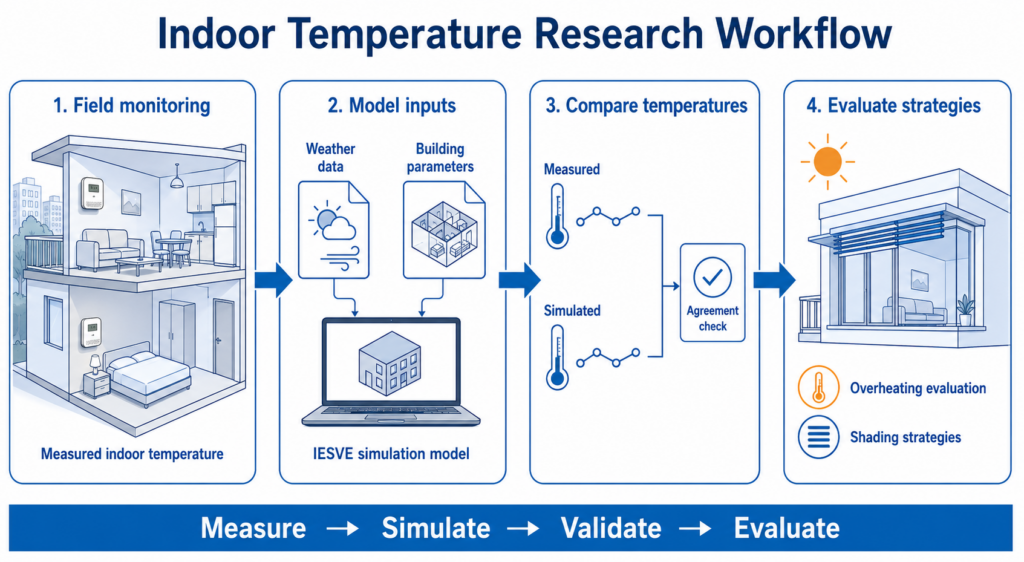
    Second, the research team built an IESVE simulation model of a representative 18-storey reinforced concrete residential building. The building was a slab-type apartment building with north-south ventilation. The simulation focused on the south-facing bedroom and living room on the 10th floor to reduce interference from ground heat transfer, roof solar radiation, and external wall boundary effects.

    Third, the building envelope parameters were adjusted according to local standards in each climate sub-region. Wall, window, roof, and ground U-values were defined separately for the five regions so that the simulated buildings matched local thermal-design requirements.

    Fourth, the researchers modelled natural ventilation rather than air-conditioning during summer. Ventilation schedules, infiltration rates, internal gains from people, lighting, and equipment, and heating-period settings were defined to match residential operation assumptions and Chinese building standards.

    Fifth, horizontal shading devices were simulated on the south-facing bedroom and living-room windows. Two key shading parameters were tested: W, the projection width of the overhang, and H, the vertical distance between the lower edge of the shading device and the upper edge of the window. H ranged from 0 m to 1.2 m in 0.1 m steps, while W ranged from 0 m to 0.7 m in 0.1 m steps in the simulation setup described in the paper.

    Finally, UbiBot-measured indoor temperature data from the Shenyang dwelling were used to validate the model. The validated model was then applied to evaluate overheating duration, solar gain, and annual energy consumption under different shading configurations.

    Key Research Findings

    The study found that residential buildings in all five representative cities experienced different degrees of summer overheating under natural ventilation.
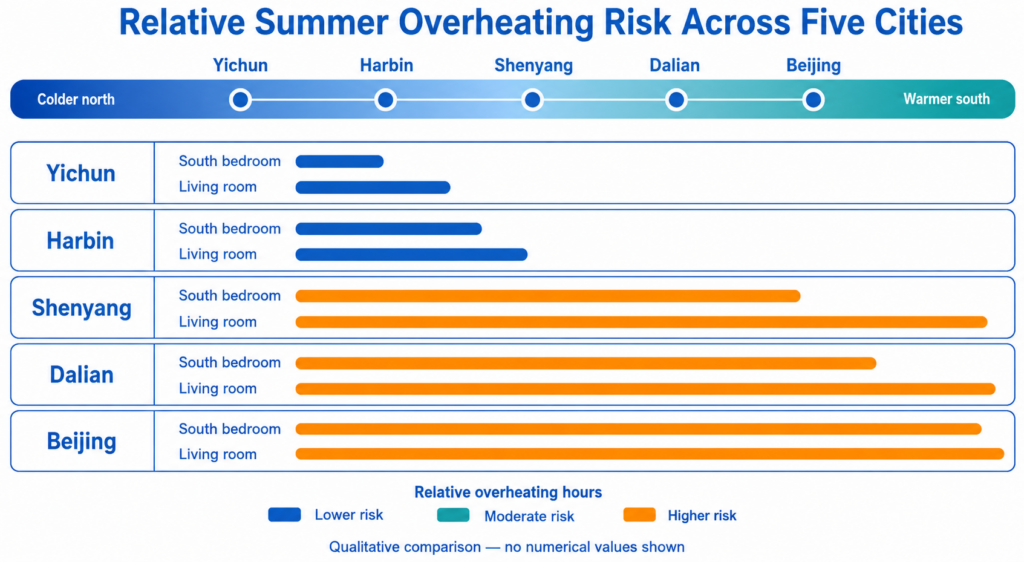
    Using CIBSE TM59 criteria, the south bedroom exceeded the relevant temperature thresholds for 401 hours in Yichun, 1296 hours in Harbin, 1819 hours in Shenyang, 1636 hours in Dalian, and 3322 hours in Beijing. Living-room overheating was also observed, with 159 hours in Yichun, 481 hours in Harbin, 809 hours in Shenyang, 798 hours in Dalian, and 2693 hours in Beijing for operative temperature above 26 °C.

    The study also used CIBSE Guide A. Under that assessment, the south bedroom exceeded 26 °C for 145 hours in Yichun, 503 hours in Harbin, 812 hours in Shenyang, 832 hours in Dalian, and 3120 hours in Beijing. These results showed that overheating becomes more severe as the climate becomes warmer and latitude decreases, with Beijing showing the most serious overheating risk.

    Horizontal shading reduced overheating duration to different degrees. When the shading projection W was 1.2 m and H was 0 m, overheating hours in the south bedroom were reduced by 18 hours in Yichun, 83 hours in Harbin, 64 hours in Shenyang, 43 hours in Dalian, and 521 hours in Beijing. The percentage reductions were 12.41%, 16.50%, 7.88%, 5.17%, and 16.70%, respectively.

    However, shading also increased annual heating energy consumption because it reduced solar radiation entering the building during winter. Without shading, annual energy consumption in Yichun, Harbin, Shenyang, Dalian, and Beijing was 193.1, 167.8, 126.4, 112.7, and 96.0 kWh/m², respectively. With W = 1.2 m and H = 0 m, energy consumption increased to 199.0, 173.3, 132.6, 119.6, and 101.4 kWh/m².

    The study therefore proposed balanced shading dimensions. Recommended horizontal shading values included W = 0.8 m and H = 0.6 m for Yichun, W = 0.7 m and H = 0.5 m for Harbin, W = 0.7 m and H = 0.4 m for Shenyang, W = 0.6 m and H = 0.4 m for Dalian, and W = 0.6 m and H = 0.4 m for Beijing.

    What This Means for Residential Overheating and Shading Design

    This study indicates that summer overheating should be taken seriously even in China’s severe cold and cold regions. These regions have historically been treated as winter-heating-dominated climates, but the simulation and field-validation workflow shows that naturally ventilated homes may experience significant summer overheating, especially in south-facing rooms.
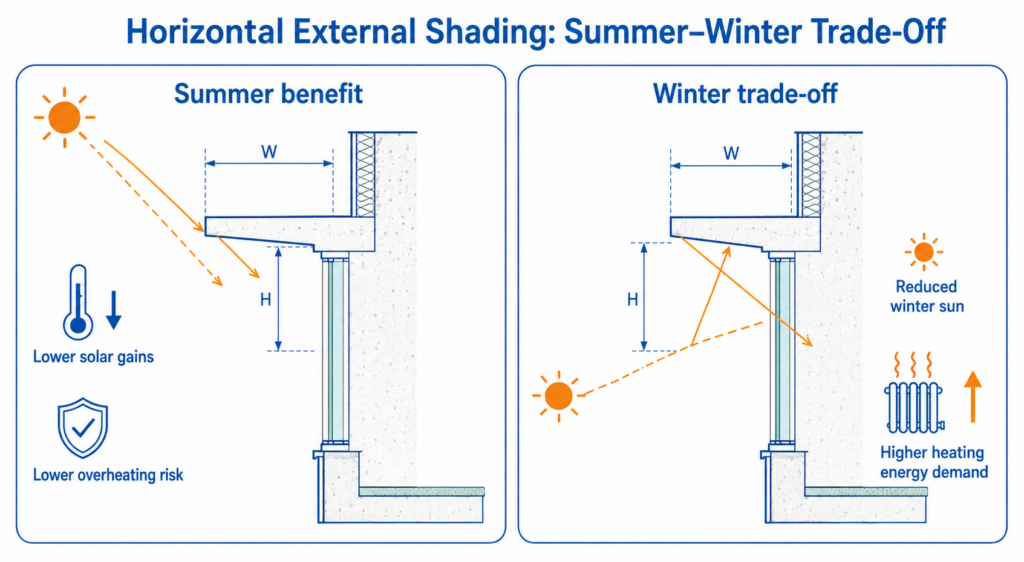
    For residential building design, the findings suggest that winter insulation alone is not sufficient. Buildings need to balance winter heat retention with summer heat rejection. Horizontal external shading can reduce solar heat gain and improve summer thermal comfort, but oversized shading can increase winter heating demand. Therefore, shading design should be climate-specific and should consider both overheating reduction and annual energy consumption.

    For policy, the research suggests that current Chinese building standards may need revision. Existing codes recommend shading mainly in cold region 2B, but the study found overheating and shading benefits in other severe cold and cold sub-regions as well. This supports the inclusion of summer overheating assessment and passive shading strategies in future building standards.

    For building simulation practice, the study demonstrates the importance of field data. UbiBot-measured indoor temperature data helped validate the IESVE model, making the simulation-based conclusions more grounded in observed building performance.

    Application Value of UbiBot Devices

    The UbiBot sensors demonstrated value as field-monitoring tools in this building-performance research.
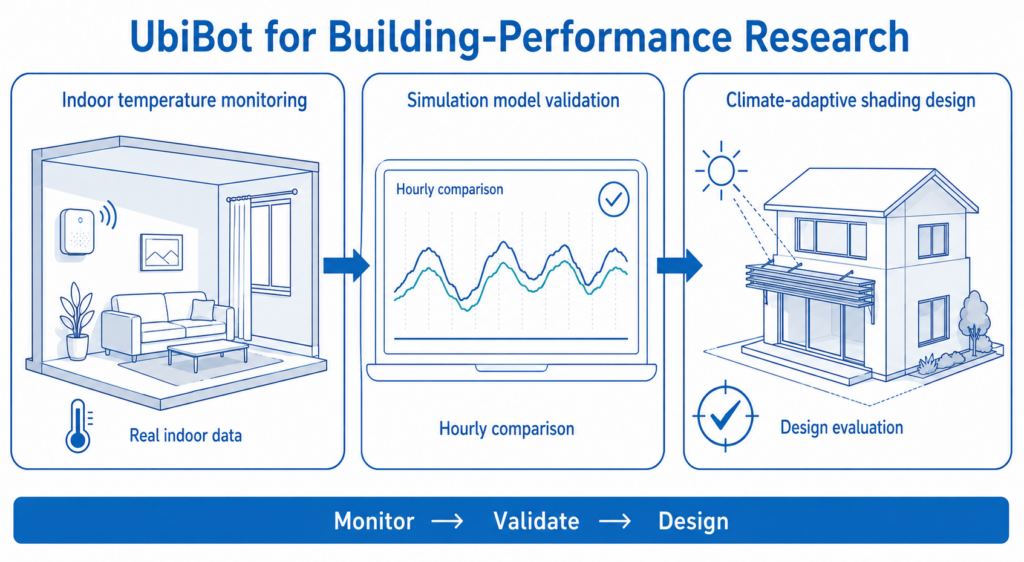
    First, they provided empirical indoor temperature data from a real dwelling. This allowed the researchers to compare simulation outputs with measured indoor conditions rather than relying only on theoretical models.

    Second, the sensors supported room-level monitoring. By placing sensors in the living room and south bedroom, the study obtained data from the spaces most relevant to residential overheating and shading analysis.

    Third, UbiBot’s wireless data-upload function supported continuous monitoring across the May-to-September summer period. Long-duration time-series temperature data are essential for overheating research because overheating depends on accumulated hours above comfort thresholds.

    Fourth, the measured data were used for simulation validation. This is one of the most important roles of UbiBot in the study: it helped establish whether the IESVE model could reproduce real indoor temperature trends before being used to test different shading designs.

    Fifth, the device’s parameter range and accuracy made it suitable for indoor thermal-environment research. The paper reports a temperature accuracy of ±0.3 °C, which is appropriate for comparing measured and simulated indoor temperature trends.

    Overall, UbiBot’s application value in this paper lies in connecting real residential monitoring with building simulation, thermal comfort assessment, and passive design-policy analysis.

    Extended Application Scenarios
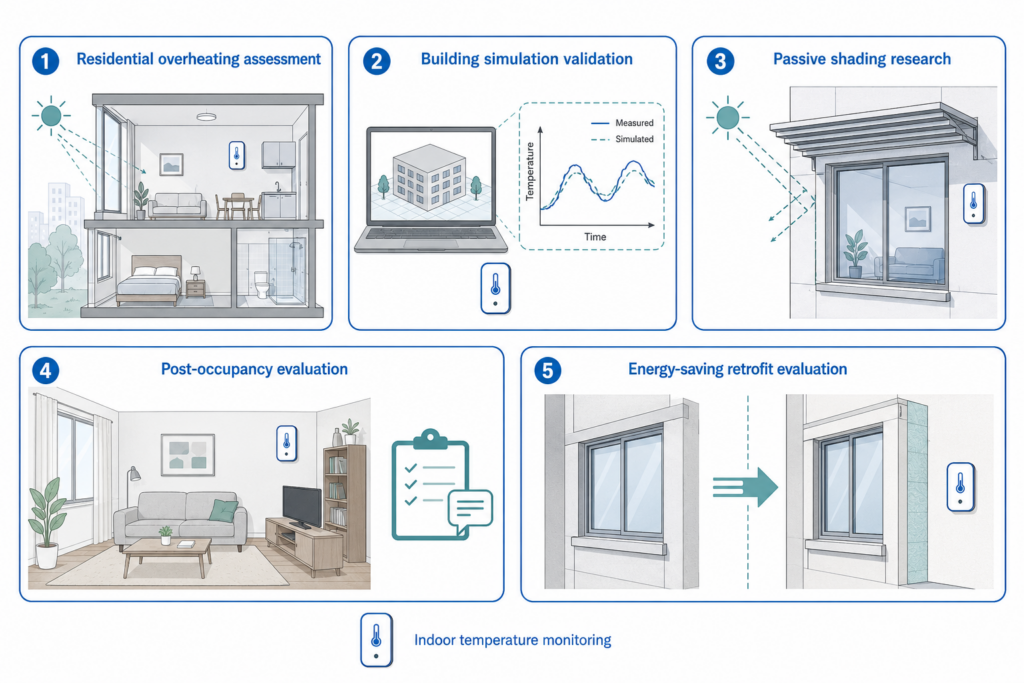
    The monitoring approach used in this study can be extended to several related scenarios:

    1. Residential overheating assessment
      Used to monitor summer indoor temperature in apartments, dormitories, and residential buildings.
    2. Building simulation validation
      Used to provide measured data for validating IESVE, EnergyPlus, DesignBuilder, or other building-performance models.
    3. Passive shading design research
      Used to compare indoor temperatures before and after installing overhangs, louvers, blinds, or other shading devices.
    4. Post-occupancy evaluation
      Used to assess whether completed buildings perform as expected under real summer conditions.
    5. Climate-adaptation studies
      Used to monitor how homes in cold-climate regions respond to warmer summers and heat waves.
    6. Indoor thermal comfort studies
      Used to compare bedroom, living-room, classroom, office, or care-home thermal conditions.
    7. Building code research
      Used to provide field evidence for revising overheating, shading, and energy-efficiency standards.
    8. Energy-saving retrofit evaluation
      Used to compare indoor conditions before and after envelope, ventilation, or shading retrofits.
    FAQ

    1. Which UbiBot product was used in the study?

    The paper describes sensors produced by UbiBot and lists an external  UB-DT-P1 (DS18B20) sensor in the sensor-parameter table.

    2. What data did UbiBot collect?

    For model validation, the key data used were hourly indoor temperature measurements. The sensor parameter table also indicates that the device supports temperature, humidity, and illumination acquisition.

    3. Where were the sensors installed?

    Sensors were placed on the walls of the living room and south bedroom in a monitored dwelling in Shenyang, China.

    4. What was the monitoring period?

    The monitored indoor temperature data covered May 1 to September 30, 2021.

    5. What was the sampling frequency?

    The paper states that the measured dataset contained hourly temperature data. It does not specify the raw sensor logging interval.

    6. How were the UbiBot data used?

    The data were used to validate the IESVE simulation model by comparing measured and simulated indoor temperature values.

    7. Did UbiBot prove that horizontal shading reduces overheating?

    No. UbiBot collected real indoor temperature data for model validation. The researchers then used the validated simulation model to analyse how horizontal shading affected overheating and energy consumption.

    8. Which cities were studied?

    The simulation covered Yichun, Harbin, Shenyang, Dalian, and Beijing, representing severe cold and cold climate sub-regions in China.

    9. What was the main finding?

    The study found that all five representative cities experienced summer overheating to different degrees, and that horizontal shading can reduce overheating but must be designed carefully to avoid excessive winter heating-energy penalties.

    10. Why is this research important?

    It shows that severe cold and cold regions should not focus only on winter heating. Summer thermal comfort, passive shading, and climate-adaptive residential design also need to be considered.


    Related Resources

    University of South China Uses UbiBot GS1 to Monitor Temperature and Humidity in a Uranium Mill Tailings Pond Cover-Layer Experiment
    How Do Sensor Calibration, Drift, and Traceability Affect Measurement Accuracy?
    UbiBot vs ELPRO vs Dickson vs Testo: Which Monitoring System Fits a GDP Pharmaceutical Warehouse?
    Beijing Jiaotong University and ETH Zurich Study Use UbiBot GS1 for Hygrothermal Monitoring in a Rural Poured Earth and Straw Building
    Laboratory Temperature & Humidity Monitor
    menu-header-svg
    Search
    • Explore Knowledge
      • Comparison & Selection
      • Industry Solution
      • Product & Device
      • Criterion & Compliance
      • Deployment & Usage
      • Technology & Principle
    • Academic Research
    • In-depth Tech

    Academic Research

    See More >>

    Harbin Institute of Technology Uses UbiBot Sensors to Monitor Residential Indoor Temperature for Overheating and Shading Analysis

    Research Overview

    Paper Title Temperature-humidity evolution and radon exhalation mechanism of red clay-bentonite covering layer in uranium mill tailings pond
    Publisher Springer Nature
    Journey Scientific Reports
    Publish Time January 2024
    Authors / Institutions Chao Xie, Wenjun Lu, Hong Wang, Xiangshuai Wang, and Tao Yu; University of South China; Key Laboratory of Advanced Nuclear Energy Technology Design and Safety, Ministry of Education
    UbiBot Product UbiBot GS1 industrial temperature and humidity recorder
    Data Collected Temperature and humidity of the uranium mill tailings pond cover layer
    Sampling Frequency Continuous temperature and humidity monitoring; radon concentration was sampled every 10 minutes during each 3-hour measurement period, and corresponding temperature and humidity data were extracted at the same time
    Research Period Two cover-layer models were placed under the same natural outdoor environment for 7 days; five radon measurement periods were used for comparative analysis
    Application Scenario Uranium mill tailings pond remediation, cover-layer temperature and humidity monitoring, radon exhalation mechanism analysis, red clay-bentonite cover-layer performance evaluation
    Original Link https://doi.org/10.1038/s41598-023-50733-w

    Research Background: What Problem Did This Study Address?

    Residential buildings in China’s severe cold and cold regions have traditionally been designed around winter heating performance. Local building codes mainly emphasise insulation, airtightness, and heating-energy reduction because these regions experience long and cold winters. However, with global warming and more frequent summer heat events, buildings that are optimised for retaining heat in winter may also face increased overheating risk in summer.

    The study focused on a policy and design gap. Current standards in these climate regions generally assume that summer overheating is not a major concern. As a result, there are limited requirements for summer shading, overheating assessment, or passive heat-protection strategies, except for limited recommendations in cold region 2B.

    The researchers investigated whether naturally ventilated residential buildings in Yichun, Harbin, Shenyang, Dalian, and Beijing experience summer overheating, and whether external horizontal shading devices can reduce overheating without causing excessive annual energy penalties. The study used IESVE building simulation to model an 18-storey reinforced concrete residential building and evaluate indoor operative temperature and energy consumption under different shading designs.

    UbiBot sensors were used in the empirical validation stage. The research team monitored indoor temperature in a real dwelling in Shenyang and compared measured data with simulated results. These measured data helped validate the simulation model before the model was used to analyse overheating and shading strategies across the five representative cities.

    The Specific Role of  UbiBot indoor temperature monitoring

    In this study, UbiBot sensors were used to collect real indoor temperature data for validating the IESVE simulation model. The paper does not state that UbiBot itself proved the effectiveness of horizontal shading. Instead, the researchers used UbiBot-generated field measurements as empirical evidence to check whether the simulation model could reasonably reproduce real indoor thermal conditions.

    The monitoring was conducted in a residential dwelling in Shenyang, China. Sensors were placed on the wall of the living room and the bedroom. According to the sensor-position diagram in the paper, one sensor was installed in the living room and another was installed in the south bedroom. This placement allowed the researchers to collect room-level indoor temperature data from the same types of spaces later analysed in the simulation: the living room and south-facing bedroom.

    The monitored period was from May 1 to September 30, 2021. The paper states that the measured data contained hourly indoor temperature values during this period. These hourly temperature data were used together with local meteorological data from the same period to validate the IESVE model.

    The paper describes the UbiBot sensor as having a temperature measurement range from 10 °C to 55 °C and an accuracy of ±0.3 °C for the validation section. In the sensor-parameter table, the device is also described with a UB-DT-P1 (DS18B20) external sensor, Wi-Fi network connection, temperature range of −20 °C to 60 °C, humidity range of 10–90%, and illumination range of 0.01–83 K lux. However, in the model validation workflow, the key dataset used was indoor temperature.

    UbiBot  UB-DT-P1 (DS18B20) external sensor

    The UbiBot data were used for model validation, not experimental control. The researchers selected measured and simulated temperature data at 6 a.m., 12 a.m., 6 p.m., and 12 p.m. each day and calculated Pearson correlation coefficients between measured and simulated results. The overall correlation coefficients were 0.7232 for the living room and 0.7029 for the bedroom, which the authors interpreted as showing strong consistency between simulation and field measurement.

    In practical terms, UbiBot provided the real indoor thermal dataset that supported the reliability of the simulation. Once validated, the simulation model was then used to test overheating duration, horizontal shading dimensions, solar gain reduction, and annual energy-consumption changes across five climate sub-regions.

    Research Methods and Data Collection Approach

    The study combined field monitoring, building simulation, overheating assessment, and shading-parameter comparison.

    First, the researchers selected five representative cities from China’s severe cold and cold climate regions: Yichun, Harbin, Shenyang, Dalian, and Beijing. These cities corresponded to severe cold 1A, severe cold 1B, severe cold 1C, cold 2A, and cold 2B climate sub-regions.

    Second, the research team built an IESVE simulation model of a representative 18-storey reinforced concrete residential building. The building was a slab-type apartment building with north-south ventilation. The simulation focused on the south-facing bedroom and living room on the 10th floor to reduce interference from ground heat transfer, roof solar radiation, and external wall boundary effects.

    Third, the building envelope parameters were adjusted according to local standards in each climate sub-region. Wall, window, roof, and ground U-values were defined separately for the five regions so that the simulated buildings matched local thermal-design requirements.

    Fourth, the researchers modelled natural ventilation rather than air-conditioning during summer. Ventilation schedules, infiltration rates, internal gains from people, lighting, and equipment, and heating-period settings were defined to match residential operation assumptions and Chinese building standards.

    Fifth, horizontal shading devices were simulated on the south-facing bedroom and living-room windows. Two key shading parameters were tested: W, the projection width of the overhang, and H, the vertical distance between the lower edge of the shading device and the upper edge of the window. H ranged from 0 m to 1.2 m in 0.1 m steps, while W ranged from 0 m to 0.7 m in 0.1 m steps in the simulation setup described in the paper.

    Finally, UbiBot-measured indoor temperature data from the Shenyang dwelling were used to validate the model. The validated model was then applied to evaluate overheating duration, solar gain, and annual energy consumption under different shading configurations.

    Key Research Findings

    The study found that residential buildings in all five representative cities experienced different degrees of summer overheating under natural ventilation.

    Using CIBSE TM59 criteria, the south bedroom exceeded the relevant temperature thresholds for 401 hours in Yichun, 1296 hours in Harbin, 1819 hours in Shenyang, 1636 hours in Dalian, and 3322 hours in Beijing. Living-room overheating was also observed, with 159 hours in Yichun, 481 hours in Harbin, 809 hours in Shenyang, 798 hours in Dalian, and 2693 hours in Beijing for operative temperature above 26 °C.

    The study also used CIBSE Guide A. Under that assessment, the south bedroom exceeded 26 °C for 145 hours in Yichun, 503 hours in Harbin, 812 hours in Shenyang, 832 hours in Dalian, and 3120 hours in Beijing. These results showed that overheating becomes more severe as the climate becomes warmer and latitude decreases, with Beijing showing the most serious overheating risk.

    Horizontal shading reduced overheating duration to different degrees. When the shading projection W was 1.2 m and H was 0 m, overheating hours in the south bedroom were reduced by 18 hours in Yichun, 83 hours in Harbin, 64 hours in Shenyang, 43 hours in Dalian, and 521 hours in Beijing. The percentage reductions were 12.41%, 16.50%, 7.88%, 5.17%, and 16.70%, respectively.

    However, shading also increased annual heating energy consumption because it reduced solar radiation entering the building during winter. Without shading, annual energy consumption in Yichun, Harbin, Shenyang, Dalian, and Beijing was 193.1, 167.8, 126.4, 112.7, and 96.0 kWh/m², respectively. With W = 1.2 m and H = 0 m, energy consumption increased to 199.0, 173.3, 132.6, 119.6, and 101.4 kWh/m².

    The study therefore proposed balanced shading dimensions. Recommended horizontal shading values included W = 0.8 m and H = 0.6 m for Yichun, W = 0.7 m and H = 0.5 m for Harbin, W = 0.7 m and H = 0.4 m for Shenyang, W = 0.6 m and H = 0.4 m for Dalian, and W = 0.6 m and H = 0.4 m for Beijing.

    What This Means for Residential Overheating and Shading Design

    This study indicates that summer overheating should be taken seriously even in China’s severe cold and cold regions. These regions have historically been treated as winter-heating-dominated climates, but the simulation and field-validation workflow shows that naturally ventilated homes may experience significant summer overheating, especially in south-facing rooms.

    For residential building design, the findings suggest that winter insulation alone is not sufficient. Buildings need to balance winter heat retention with summer heat rejection. Horizontal external shading can reduce solar heat gain and improve summer thermal comfort, but oversized shading can increase winter heating demand. Therefore, shading design should be climate-specific and should consider both overheating reduction and annual energy consumption.

    For policy, the research suggests that current Chinese building standards may need revision. Existing codes recommend shading mainly in cold region 2B, but the study found overheating and shading benefits in other severe cold and cold sub-regions as well. This supports the inclusion of summer overheating assessment and passive shading strategies in future building standards.

    For building simulation practice, the study demonstrates the importance of field data. UbiBot-measured indoor temperature data helped validate the IESVE model, making the simulation-based conclusions more grounded in observed building performance.

    Application Value of UbiBot Devices

    The UbiBot sensors demonstrated value as field-monitoring tools in this building-performance research.

    First, they provided empirical indoor temperature data from a real dwelling. This allowed the researchers to compare simulation outputs with measured indoor conditions rather than relying only on theoretical models.

    Second, the sensors supported room-level monitoring. By placing sensors in the living room and south bedroom, the study obtained data from the spaces most relevant to residential overheating and shading analysis.

    Third, UbiBot’s wireless data-upload function supported continuous monitoring across the May-to-September summer period. Long-duration time-series temperature data are essential for overheating research because overheating depends on accumulated hours above comfort thresholds.

    Fourth, the measured data were used for simulation validation. This is one of the most important roles of UbiBot in the study: it helped establish whether the IESVE model could reproduce real indoor temperature trends before being used to test different shading designs.

    Fifth, the device’s parameter range and accuracy made it suitable for indoor thermal-environment research. The paper reports a temperature accuracy of ±0.3 °C, which is appropriate for comparing measured and simulated indoor temperature trends.

    Overall, UbiBot’s application value in this paper lies in connecting real residential monitoring with building simulation, thermal comfort assessment, and passive design-policy analysis.

    Extended Application Scenarios

    The monitoring approach used in this study can be extended to several related scenarios:

    1. Residential overheating assessment
      Used to monitor summer indoor temperature in apartments, dormitories, and residential buildings.
    2. Building simulation validation
      Used to provide measured data for validating IESVE, EnergyPlus, DesignBuilder, or other building-performance models.
    3. Passive shading design research
      Used to compare indoor temperatures before and after installing overhangs, louvers, blinds, or other shading devices.
    4. Post-occupancy evaluation
      Used to assess whether completed buildings perform as expected under real summer conditions.
    5. Climate-adaptation studies
      Used to monitor how homes in cold-climate regions respond to warmer summers and heat waves.
    6. Indoor thermal comfort studies
      Used to compare bedroom, living-room, classroom, office, or care-home thermal conditions.
    7. Building code research
      Used to provide field evidence for revising overheating, shading, and energy-efficiency standards.
    8. Energy-saving retrofit evaluation
      Used to compare indoor conditions before and after envelope, ventilation, or shading retrofits.

    FAQ

    1. Which UbiBot product was used in the study?

    The paper describes sensors produced by UbiBot and lists an external  UB-DT-P1 (DS18B20) sensor in the sensor-parameter table.

    2. What data did UbiBot collect?

    For model validation, the key data used were hourly indoor temperature measurements. The sensor parameter table also indicates that the device supports temperature, humidity, and illumination acquisition.

    3. Where were the sensors installed?

    Sensors were placed on the walls of the living room and south bedroom in a monitored dwelling in Shenyang, China.

    4. What was the monitoring period?

    The monitored indoor temperature data covered May 1 to September 30, 2021.

    5. What was the sampling frequency?

    The paper states that the measured dataset contained hourly temperature data. It does not specify the raw sensor logging interval.

    6. How were the UbiBot data used?

    The data were used to validate the IESVE simulation model by comparing measured and simulated indoor temperature values.

    7. Did UbiBot prove that horizontal shading reduces overheating?

    No. UbiBot collected real indoor temperature data for model validation. The researchers then used the validated simulation model to analyse how horizontal shading affected overheating and energy consumption.

    8. Which cities were studied?

    The simulation covered Yichun, Harbin, Shenyang, Dalian, and Beijing, representing severe cold and cold climate sub-regions in China.

    9. What was the main finding?

    The study found that all five representative cities experienced summer overheating to different degrees, and that horizontal shading can reduce overheating but must be designed carefully to avoid excessive winter heating-energy penalties.

    10. Why is this research important?

    It shows that severe cold and cold regions should not focus only on winter heating. Summer thermal comfort, passive shading, and climate-adaptive residential design also need to be considered.

    分享

    LinkedIn2

    Facebook2

    X

    Newsletter Signup

    Related Resources

    University of South China Uses UbiBot GS1 to Monitor Temperature and Humidity in a Uranium Mill Tailings Pond Cover-Layer Experiment
    How Do Sensor Calibration, Drift, and Traceability Affect Measurement Accuracy?
    UbiBot vs ELPRO vs Dickson vs Testo: Which Monitoring System Fits a GDP Pharmaceutical Warehouse?
    Beijing Jiaotong University and ETH Zurich Study Use UbiBot GS1 for Hygrothermal Monitoring in a Rural Poured Earth and Straw Building
    Laboratory Temperature & Humidity Monitor
    menu-header-svg
    Search
    • Explore Knowledge
      • Comparison & Selection
      • Industry Solution
      • Product & Device
      • Criterion & Compliance
      • Deployment & Usage
      • Technology & Principle
    • Academic Research
    • In-depth Tech
    Enter Your Information

    Confirm

    Products

    Dashboards

    Support

    Purchase

    Company

    Smart Sensing

    UbiBot Web Console

    APP Download

    UbiBot Online Store

    News

    Smart Control

    UbiBot Space

    Product Docs & APIs

    Find Distributors

    About Us

    Smart Video

    UbiBot On-Premises

    Helpdesk & FAQ

    Volume Pricing

    Contact Us

    LoRa Products

    Agency Web Console

    Video Center

    Architecture

    Software & Platform


    Pricing


    System Status

    External Sensors


    Become a Distributor

    Accessories


    Become an Affiliate

    Global SIM


    Positioning System


    Products

    Dashboards

    Business Partners

    WS1

    UbiBot Web Console

    Volume Pricing

    WS1 Pro

    UbiBot Space

    Become a Distributor

    GS1

    UbiBot Support Desk

    Affiliates

    GS2

    Agency Web Console


    MS1


    SP1


    Accessories


    Docs

    Purchase

    Company

    Platform API

    Pricing

    News

    Q&A

    UbiBot Partners

    About us

    Privacy Policy

    Online Store

    Contact

    Terms of Service


    System Status

    Products

    Dashboards

    Smart Sensing

    UbiBot Web Console

    Smart Control

    UbiBot Space

    Smart Video

    UbiBot On-Premises

    LoRa Products

    Agency Web Console

    Software & Platform


    External Sensors


    Accessories


    Global SIM


    Positioning System


    Support

    Purchase

    APP Download

    UbiBot Online Store

    Product Docs & APIs

    Find Distributors

    Helpdesk & FAQ

    Volume Pricing

    Video Center


    Pricing


    Company

    News

    About Us

    Contact Us

    Architecture

    System Status

    Become a Distributor

    Become an Affiliate

    Language:
    English 日本語 (ベータ)  
    Language:

    English

    日本語 (ベータ)


    IoT Product Family:
    ubibotico     Wireless environmental sensing products and smart building solutions
    ubitrackico     UWB-based real-time indoor tracking solutions with 30cm accuracy

    IoT Product Family:

    ubibotico  Wireless environmental sensing products and smart building solutions
    ubitrackico  UWB-based real-time indoor tracking solutions with 30cm accuracy

    © 2013-2026 UbiBot.com. All rights reserved.

    Terms of Service | Privacy Policy | Compliance

    youtube facebook twitter