

.svg)
National University of Singapore Study Uses UbiBot WS1 Pro for Surface Temperature Calibration in District-Scale Thermal Infrared Monitoring
Published: August 10, 2026
Update: August 28, 2026
By Allen Lee
Research Overview
| Paper Title | District-scale surface temperatures generated from high-resolution longitudinal thermal infrared images |
| Publisher | Springer Nature |
| Journey | Scientific Data |
| Publish Time | December 2023 |
| Authors / Institutions | Subin Lin, Vasantha Ramani, Miguel Martin, Pandarasamy Arjunan, Adrian Chong, Filip Biljecki, Marcel Ignatius, Kameshwar Poolla, and Clayton Miller; Berkeley Education Alliance for Research in Singapore; National University of Singapore; University of California, Berkeley; Indian Institute of Science |
| UbiBot Product | UbiBot WS1 Pro smart sensor |
| Data Collected | Contact surface temperature from temperature probes at calibration positions B and C |
| Sampling Frequency | The paper does not explicitly state the raw UbiBot logging interval; calibration analysis used a 5-minute temporal resolution for Positions B and C |
| Research Period | Thermal image dataset: Kent Vale from November 8, 2021 to March 8, 2022; S16 from August 3, 2022 to December 14, 2022. Surface-temperature calibration measurements were conducted during the thermal observatory validation period |
| Application Scenario | Urban thermal infrared monitoring, district-scale surface temperature dataset calibration, building facade thermal performance analysis, urban microclimate research, urban heat island analysis |
| Original Link | https://doi.org/10.1038/s41597-023-02749-0 |
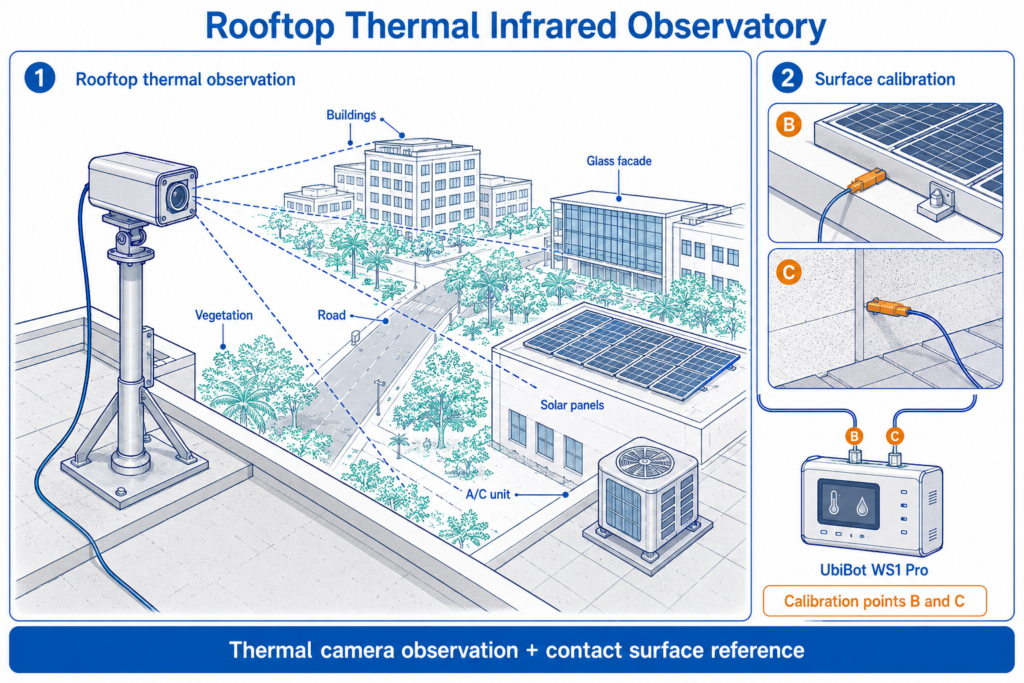
Study overview: UbiBot WS1 Pro supported surface-temperature calibration for district-scale rooftop thermal infrared monitoring.
Research Background: What Problem Did This Study Address?
Infrared thermography is widely used to study the built environment, including urban heat islands, building diagnostics, urban heat fluxes, and facade thermal performance. However, many existing thermal infrared datasets are collected either at the city scale, using satellites or aerial platforms, or at the building scale, using handheld devices or drones. There is a gap at the district scale, where researchers need high-resolution, long-term observations of multiple buildings, roads, vegetation, and infrastructure elements interacting over time.
This study introduced a rooftop thermal infrared observatory in Singapore, a tropical urban environment. The observatory was designed to collect high-temporal-resolution thermal images from fixed rooftop locations, allowing researchers to examine the surface temperature trends of buildings, roads, trees, glass facades, air-conditioning units, and other urban elements.
The paper describes a large public dataset containing 1,365,921 thermal images collected from two rooftop observatories: Kent Vale and S16. The images were captured on average at approximately 10-second intervals over ten months, with supporting weather station data and preprocessing code.
A key technical challenge in this type of research is calibration. Thermal cameras estimate surface temperature from infrared radiation, but outdoor measurements are affected by emissivity, atmospheric transmission, humidity, air temperature, sky radiation, window transmission, and camera calibration parameters. To improve the accuracy of the thermal-image-derived surface temperatures, the researchers used contact surface sensors at selected calibration positions. UbiBot WS1 Pro smart sensor was part of this calibration workflow, connecting temperature probes at two positions used to compare measured surface temperature against the infrared camera estimates.
The Specific Role of UbiBot WS1 Pro Thermal Image Calibration
In this study, UbiBot WS1 Pro smart sensor was used as a contact temperature data logging device in the technical validation stage of the rooftop thermal infrared observatory. The paper does not present WS1 Pro smart sensor as the main device collecting district-scale thermal images. The main remote-sensing data were captured by FLIR A300 thermal cameras installed on rooftop observatories. UbiBot’s role was to support calibration by recording contact surface temperatures at specific calibration points.
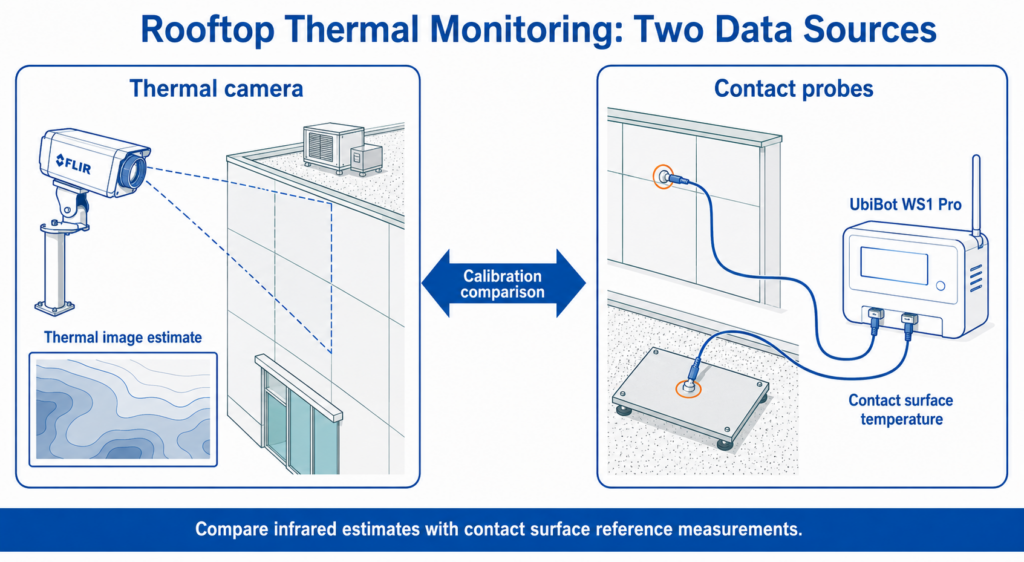
FLIR A300 captured thermal images, while UbiBot-connected probes provided contact surface-temperature reference data for calibration.
The thermal observatory used a FLIR A300 thermal camera mounted on a pan/tilt device. The camera was protected by a weatherproof housing and installed on rooftop truss towers at two locations in Singapore: Kent Vale and S16. These observatories captured thermal images of university buildings, vegetation, roads, solar panels, glass materials, and air-conditioning units.
For calibration, the researchers placed contact surface sensors at three positions, labelled A, B, and C in the paper. At Position A, a heat flux sensor and a temperature probe were connected to a Hioki data logger. At Positions B and C, temperature probes were connected to UbiBot WS1 Pro indoor monitoring sensors. These UbiBot-connected probes provided measured surface-temperature data from the physical surfaces observed by the thermal camera.
The WS1 Pro smart sensor data were used for calibration, not for remote sensing. The researchers compared surface temperatures estimated from thermal images with surface temperatures measured by contact sensors. The goal was to tune the FLIR A300 calibration parameters so that image-derived temperature values matched measured surface temperatures more closely in outdoor conditions.
The paper reports that calibration performance was evaluated using Mean Bias Error and Root Mean Square Error. The optimised temporal resolution was 30 minutes for Position A and 5 minutes for Positions B and C. After calibration, RMSE values at Positions A to C were below 2 °C, and MBE values were within ±1 °C.
Therefore, WS1 Pro smart sensor’s specific role was to provide ground-truth-style contact surface temperature measurements at calibration points B and C. These measurements helped validate and calibrate the rooftop infrared thermography dataset, making the derived surface temperature records more reliable for future urban microclimate and building-performance analysis.
Research Methods and Data Collection Approach
The study built and operated rooftop infrared thermography observatories at two locations in Singapore: Kent Vale and S16.
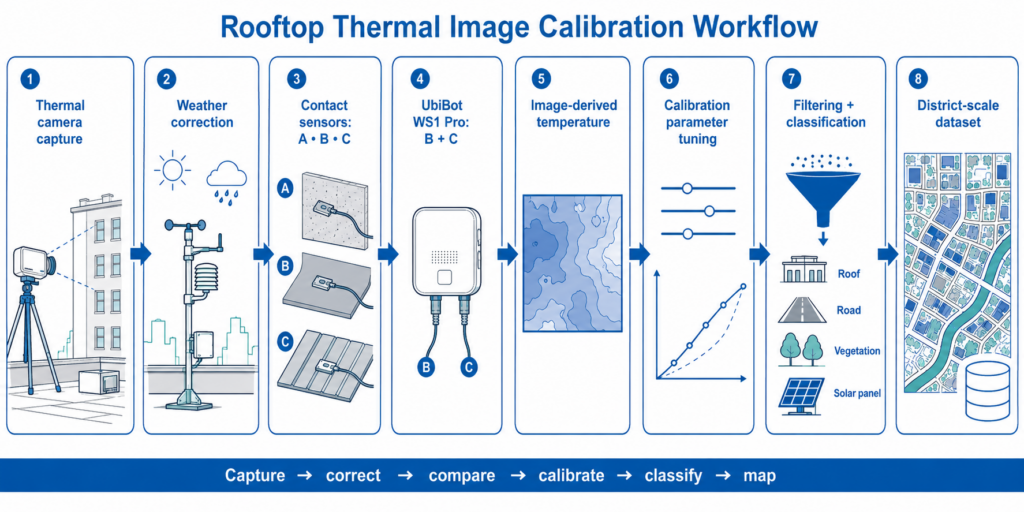
Research workflow from rooftop image capture to contact-sensor validation, calibration, filtering, classification, and surface-temperature dataset generation.
At Kent Vale, the observatory was installed on the rooftop of a 42-metre-tall residential building overlooking university campus buildings. The pan/tilt unit moved the FLIR A300 camera through four positions, capturing thermal images of buildings known as CREATE, E1A, EA, and SDE4, as well as vegetation and roads. These buildings had different facade materials, including curtain walls, concrete walls, single-pane windows, metal grids, and concrete frames.
At S16, the observatory was installed on a nine-storey university campus building. It captured thermal images from three target directions, including buildings, air-conditioning units, glass materials, vegetation, and solar panels.
The thermal camera had a 320 × 240 pixel resolution, a 7.5–13 μm spectral range, and 50 mK thermal sensitivity at 30 °C. Thermal images were collected at variable intervals, with the overall observatory collecting data on average at approximately 10-second intervals.
Weather station data were also collected at multiple locations on the campus. These stations measured air temperature, relative humidity, dew point, wind speed, wind direction, gust speed, and solar radiation at 1-minute intervals. These environmental data were used to correct atmospheric effects when deriving surface temperature from thermal images.
For technical validation, the researchers used contact surface temperature sensors. Position A used a Hioki data logger with a heat flux sensor and a temperature probe. Positions B and C used temperature probes connected to UbiBot WS1 Pro indoor monitoring sensors. These contact measurements were compared against infrared image estimates.
The dataset was processed through filtering, classification, and segmentation. Unsuitable thermal images affected by rain, blur, or pan/tilt movement were removed or classified. A convolutional neural network was used to classify Kent Vale images into building-view categories. Tools such as Flirextractor and Labelme were recommended for extracting temperature data and segmenting regions of interest.
Key Research Findings
The main output of the paper is a district-scale thermal infrared dataset rather than a single experimental conclusion. The dataset contains 1,365,921 thermal images collected over ten months from two rooftop observatories in Singapore.
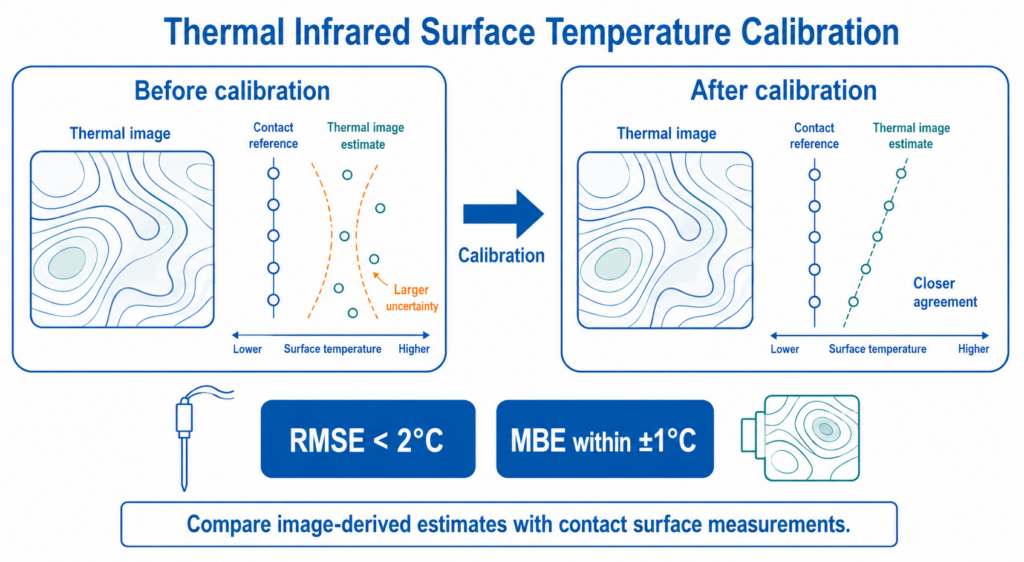
Contact surface-temperature measurements helped improve agreement between thermal-image-derived temperatures and measured surface temperatures.
The Kent Vale dataset includes 483,915 thermal images collected from November 8, 2021 to March 8, 2022. The S16 dataset includes 882,006 thermal images collected from August 3, 2022 to December 14, 2022. The dataset provides high-resolution, longitudinal thermal observations of multiple urban elements, including buildings, vegetation, roads, air-conditioning units, solar panels, and glass materials.
The study demonstrated that a rooftop thermal observatory can fill the gap between city-scale satellite thermal data and building-scale handheld or drone-based thermography. It provides a district-scale viewpoint with high temporal and spatial resolution.
The calibration process showed that thermal camera estimates can be improved by comparing them with contact surface sensor measurements. After calibration, the reported RMSE values at Positions A, B, and C were 1.24 °C, 1.69 °C, and 1.00 °C, respectively. The corresponding MBE values were −0.21 °C, 0.91 °C, and 0.55 °C. These results showed acceptable agreement between calibrated thermal-image-derived temperatures and contact surface measurements.
The study also highlighted the importance of correcting for emissivity, atmospheric transmission, air temperature, humidity, sky radiation, and window effects when estimating surface temperature from thermal images. Weather station data and surface temperature calibration data were therefore essential components of the dataset workflow.
What This Means for Urban Thermal Monitoring
This study shows that urban thermal monitoring benefits from combining rooftop thermal imaging, weather stations, contact calibration sensors, and image-processing workflows.
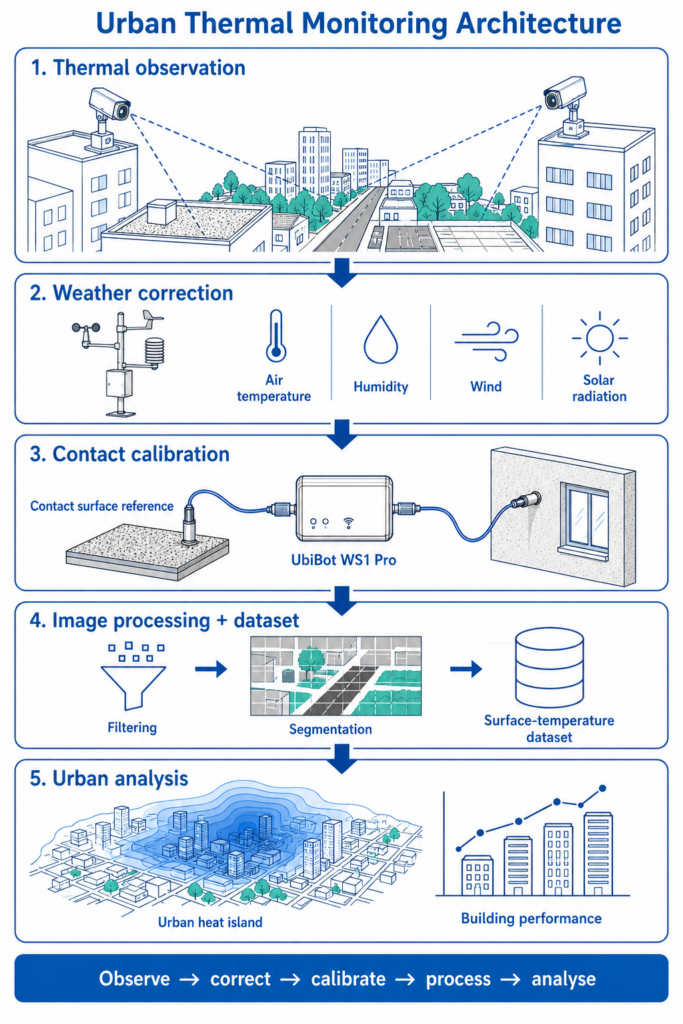
Urban thermal monitoring becomes more reliable when rooftop thermal imaging, weather stations, contact sensors, and image-processing workflows are combined.
For urban microclimate research, district-scale thermal images can reveal how different surfaces heat up and cool down over time. Buildings, roads, vegetation, glass facades, solar panels, and air-conditioning equipment all have different thermal behaviours. A long-term dataset helps researchers study these behaviours at fine temporal resolution.
For building-performance research, calibrated thermal images can support studies of facade heat retention, cooling system operation, thermal leakage, and interactions between buildings and outdoor conditions. This is especially useful for non-residential buildings, where district-scale thermal observations can capture multiple facades and systems simultaneously.
For urban heat island analysis, the dataset provides a more detailed view than satellite images and a wider view than handheld thermography. It can help researchers study how urban materials, vegetation, traffic surfaces, and building geometry influence local temperature patterns.
The study also shows that calibration is critical. Without contact surface temperature measurements and weather corrections, thermal-image-derived surface temperatures may be affected by environmental and material-related errors. UbiBot-supported contact temperature logging contributed to this validation layer.
Application Value of UbiBot Devices
UbiBot WS1 Pro demonstrated value as a calibration-support device in this district-scale thermal imaging research.
First, it provided contact surface temperature data through connected temperature probes at Positions B and C. These measurements offered reference data for checking thermal-image-derived surface temperatures.
Second, it supported outdoor thermal camera calibration. The rooftop FLIR A300 system estimated surface temperatures remotely, while UbiBot-connected probes measured actual contact surface temperatures at selected locations. Comparing these values helped tune calibration parameters.
Third, UbiBot complemented the broader sensing platform. The study combined rooftop thermal cameras, weather stations, contact sensors, image-processing code, and cloud data storage. UbiBot contributed to the contact-temperature validation component of this multi-modal workflow.
Fourth, UbiBot helped improve confidence in downstream analyses. Since the dataset is intended for urban heat island studies, building thermal performance research, and microclimate analysis, accurate calibration is important. Contact temperature measurements reduced uncertainty in the thermal image interpretation.
Fifth, the UbiBot workflow shows how compact environmental monitoring devices can support large-scale remote-sensing studies. UbiBot did not replace the thermal camera, but it provided local reference measurements that made the thermal image dataset more useful and technically credible.
Extended Application Scenarios
The monitoring approach used in this study can be extended to several related scenarios:
- Thermal infrared camera calibration
Used with contact temperature probes to validate image-derived surface temperatures from rooftop, drone, or fixed thermal cameras. - Urban heat island monitoring
Used to support long-term monitoring of surface temperature changes across buildings, roads, and vegetation. - Building facade thermal performance studies
Used to compare contact temperature measurements with infrared facade temperature estimates. - District-scale urban microclimate research
Used as part of a sensing platform combining weather stations, thermal cameras, and local surface sensors. - Building energy diagnostics
Used to support studies of facade heat transfer, HVAC operation, and surface heat retention. - Smart campus monitoring
Used to create high-resolution thermal datasets for university campuses, technology parks, or mixed-use districts. - Remote sensing validation
Used to provide ground-truth-style measurements for validating satellite, drone, or rooftop thermal sensing outputs. - Digital twin calibration
Used to supply measured surface-temperature data for calibrating urban or building digital twin models.
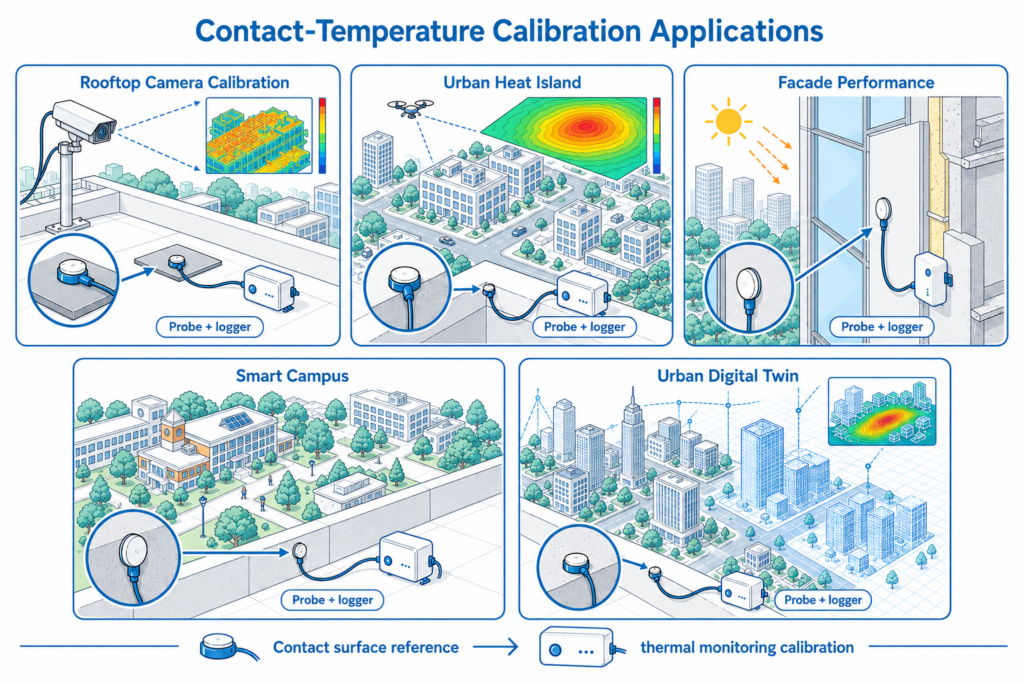
The same calibration-support approach can be extended to infrared camera calibration, urban heat island monitoring, building facade analysis, and digital twin validation.
FAQ
1. Which UbiBot product was used in the study?
The study used UbiBot WS1 Pro indoor monitoring sensors.
2. What data did UbiBot collect?
UbiBot WS1 Pro was connected to temperature probes at calibration Positions B and C to collect contact surface temperature data.
3. Where was UbiBot deployed?
The UbiBot-connected temperature probes were placed at calibration positions on surfaces observed by the rooftop thermal infrared observatory.
4. Did UbiBot collect the main thermal image dataset?
No. The main thermal image dataset was collected by FLIR A300 thermal cameras installed on rooftop observatories. UbiBot supported calibration by collecting contact surface temperature data.
5. What was the sampling frequency?
The paper does not explicitly state the raw UbiBot logging interval. Calibration analysis used a 5-minute temporal resolution for Positions B and C.
6. How were UbiBot data used?
The UbiBot-connected temperature probe data were compared with thermal-image-derived surface temperatures to support calibration of the infrared camera measurements.
7. What was the main dataset in the paper?
The dataset includes 1,365,921 thermal images collected from two rooftop observatories in Singapore over ten months.
8. What locations were studied?
Thermal images were collected from Kent Vale and S16 observatories at the National University of Singapore campus.
9. What did the calibration achieve?
After calibration, the RMSE values at the three calibration positions were below 2 °C, and MBE values were within ±1 °C.
10. Why is UbiBot relevant to this research?
UbiBot provided contact surface temperature data that helped calibrate and validate the district-scale thermal infrared image dataset, improving confidence in later urban microclimate and building performance analyses.