

UBiBot Logo
UBiBot Logo
  • UBiBot Logo
  • Home
  • Products

    NEW

  • Pricing
  • Support
  • About Us
  • Download
  • magnifying-glass  Search
  • magnifying-glass header-close
  • Sign in Sign in
    Public Web Console Public Web Console
    On-Premises App Center On-Premises App Center
  • Home
  • Products

    NEW

  • Pricing
  • Support
  • About us
  • Download
  •  Public Web Console
  •  On-Premises App Center
  • Where to Buy

Learn Hub

Explore Knowledge Academic Research In-depth Tech

Share

LinkedIn

Facebook

X (Twitter)

Newsletter Signup

Table of contents

    Livestock Barn Temperature Monitoring Deployment Guide

    Published: September 7, 2026

    Update: September 8, 2026

    By Jimmy Lianson

    Key Takeaway

    Plan barn monitoring around the animals’ occupied zone and airflow, not around convenient wall space. A dependable system combines representative temperature and humidity sensing, tested LoRa coverage, local data continuity, actionable alarms, and a maintenance process that survives dust, moisture, power loss, and changing barn conditions.

    Livestock barn temperature monitoring becomes an implementation problem as soon as a farm decides to move from periodic checks to continuous records. The difficult questions are practical: where should sensors sit relative to the animals, how many points are needed across pens or houses, how should data cross long metal-sided buildings, and what happens when power or internet access fails? A system that produces attractive cloud charts but misses the animal-level microclimate can give a false sense of control.

    The deployment also has to reflect species, age, stocking density, bedding, ventilation design, climate, and production stage. The World Organisation for Animal Health (WOAH) states that, for housed animals, air quality, temperature and humidity should support good animal health and welfare. Its species-specific guidance for dairy cattle and pigs further links thermal risk to temperature, relative humidity, airflow, stocking density and other animal factors. These principles are useful for system design, but they do not create one universal alarm threshold for every barn. Farm SOPs, veterinary guidance, production standards and local legal requirements should define the actual limits used in the monitoring platform. [1-3]

    1. Survey the Barn Before Selecting Sensors

    A pre-deployment survey should describe the barn as an environmental system. Record the animal zones, ventilation paths, heat and moisture sources, seasonal operating modes, network constraints and maintenance access before deciding how many devices to buy. This prevents a common failure: installing sensors where power and mounting are convenient rather than where the animals actually experience thermal stress.
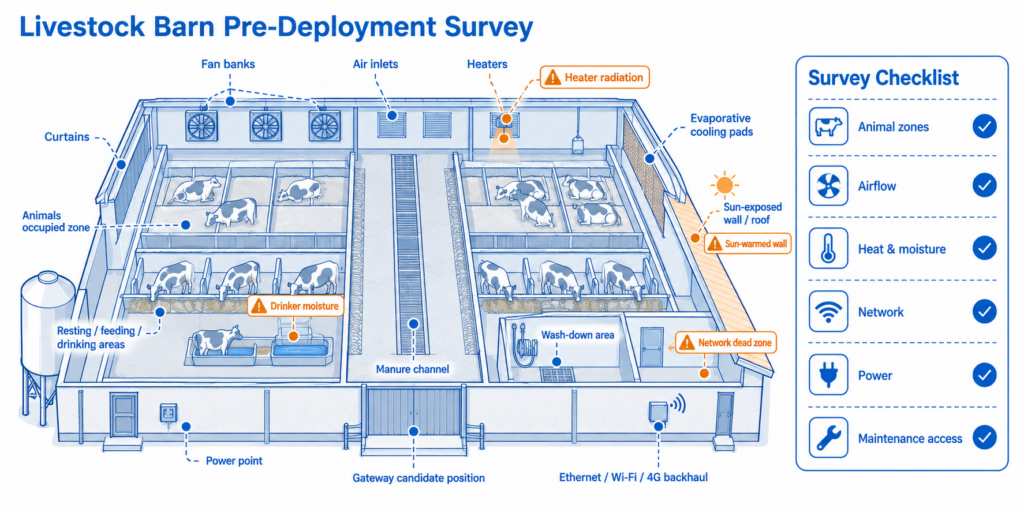
    Pre-deployment survey points for a livestock barn monitoring project.

    Figure 1. Pre-deployment survey points for a livestock barn monitoring project.

    Start with the occupied zone. Note where animals rest, feed, drink, crowd, enter and leave, and whether young animals, sick animals or high-producing animals occupy separate areas. In mechanically ventilated barns, document fan banks, inlets, curtains, tunnel-ventilation direction, evaporative cooling pads, heaters and control sensors. In naturally ventilated structures, note prevailing wind direction, ridge openings, sidewalls and areas where airflow can be blocked by adjacent buildings or stored materials.

    The survey should also identify local environmental drivers that can distort a reading. Direct solar load near translucent roof panels, radiant heat from heaters, cold air near open doors, moisture above drinkers, manure channels, bedding packs and wash-down areas can all create local conditions that differ from the average barn. These locations may deserve dedicated risk sensors, but they should not automatically be used as the only representative points for the whole facility.

    Complete the communications survey at the same time. Test radio coverage with doors, curtains and metal partitions in their normal positions, not only in an empty building. Confirm where a LoRa gateway can be mounted above obstructions, whether Ethernet or Wi-Fi is available at that gateway, whether cellular backhaul is needed for remote farms, and where protected power can be supplied. If the site has several barns, measure the real path between buildings rather than assuming an advertised outdoor range will apply through walls, equipment and terrain.

    2. Plan Monitoring Points Around Animals and Airflow

    The main sensor should measure the air the animals experience. That usually means placing temperature and humidity sensors within or close to the occupied zone while protecting them from contact, chewing, dust loading, wash-down, direct heater radiation and concentrated airflow from fans or inlets. Sensor height should follow the species and housing layout rather than a standard eye-level mounting rule.

    In a long poultry or pig building, front-to-back conditions can differ because ventilation air enters, mixes, gains heat and moisture, and then exits. A practical starting layout is to place representative points near the air-entry region, the central animal area and the downstream or exhaust region. Additional points are justified where the house contains different animal groups, significant height changes, cooling pads, heaters or recurring wet zones. Large dairy barns may need points in resting areas, holding pens and other high-density locations, particularly where fans or sprinklers create different microclimates.
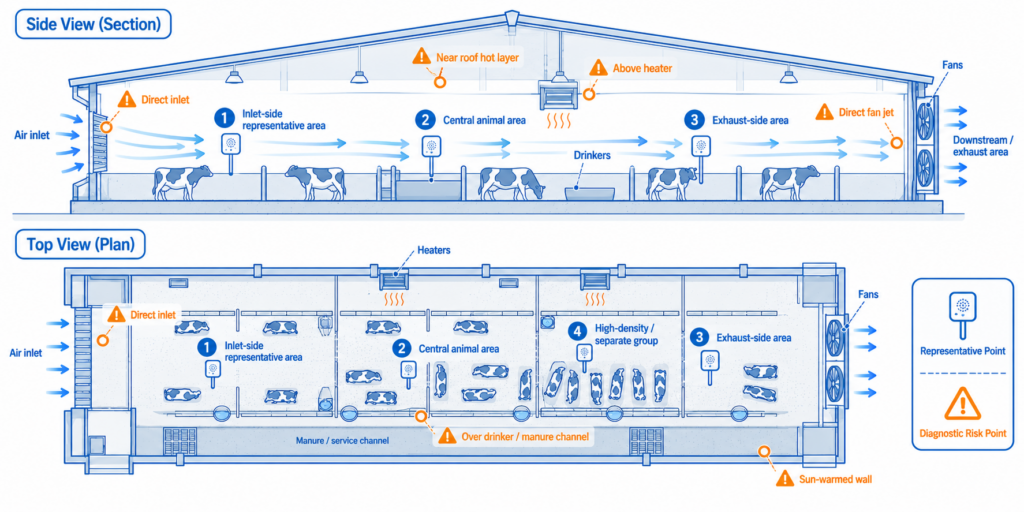
    Representative sensor placement based on animal occupied zones and airflow

    Figure 2. Representative sensor placement based on animal occupied zones and airflow.

    Avoid mounting a representative sensor directly in a fan jet, at an inlet, against a sun-warmed wall, above a heater, immediately over a drinker or manure channel, or so close to the roof that it mainly measures stratified hot air. A separate sensor can intentionally monitor those locations when the risk itself is important. The distinction is between a representative point used to describe the animals’ environment and a diagnostic point used to explain why that environment is changing.

    For new projects, begin with more temporary measurements than the final permanent network. Run sensors through typical day/night cycles and, where possible, across both warm and cold operating modes. Compare locations during fan-stage changes, curtain movement, feeding, wash-down and periods of high animal density. Permanent points should be selected from repeated patterns, not from a single afternoon survey.

    3. Choose the Sensor, Power and Network Architecture

    The best architecture separates three decisions: what must be measured, how the field device survives the barn, and how the data reaches the platform. Temperature and humidity are the core variables for this article, but some farms may also need CO2, ammonia, light, pressure or equipment-status inputs. Each additional variable should have a defined operational purpose before it is added to the system.

    The current UbiBot public catalog provides a LoRa architecture built around devices such as the DC1-L-TH temperature and humidity sensor and the GW1 or GW1-O LoRa gateway. The DC1-L-TH measures -20°C to 60°C with stated temperature accuracy of ±0.2°C from 0°C to 60°C, and 0% to 100% RH with stated humidity accuracy of ±2% RH from 10% to 90% RH. It stores up to 50,000 records locally, supports multiple battery options or DC 12 V power, and uses regional LoRa bands including EU868, US915, AU915, KR920, AS923 and IN865. [4]

    The UbiBot GW1 aggregates up to 100 LoRa nodes and can forward data to the UbiBot platform through 2.4 GHz Wi-Fi and Ethernet, with 4G available on the cellular version. UbiBot states an ideal outdoor LoRa range of up to 1 km; real barn coverage should still be tested because walls, steel cladding, machinery, elevation and terrain can reduce usable range. For gateways exposed to wet or dusty farm areas, the GW1-O provides an IP65 outdoor enclosure and supports Ethernet or 4G backhaul depending on model. [5-6]

    For barns where a local screen or external probes are valuable, the WS1 Pro-L is another current UbiBot LoRa option. It supports LoRa uplink, local storage for up to 50,000 records, four AA batteries or 5 V power, a 4.4-inch display, and external sensor interfaces. The most appropriate combination depends on whether the project needs a compact fixed node, local display, external probes, or additional environmental channels. [7]

    Power deserves the same attention as sensing. Battery operation reduces installation work, but battery life depends on reporting interval, radio quality, temperature and battery chemistry. Fixed gateway locations should normally use protected continuous power, and remote farms should define what happens during utility outages. If an environmental alarm matters during a blackout, the sensor, gateway, internet path and notification system all need an outage strategy; backing up only one component is not enough.
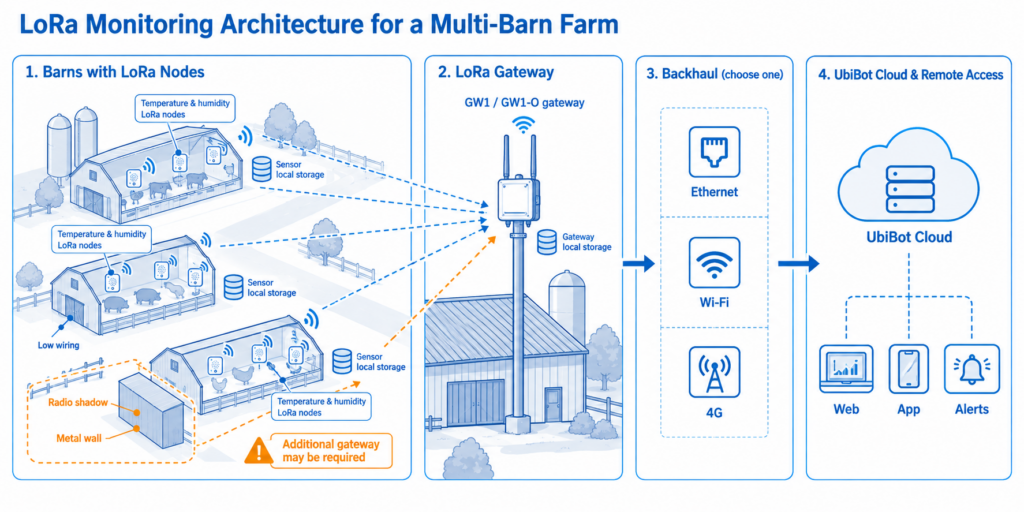
    LoRa monitoring architecture for livestock barns with local gateways and cloud backhaul.

    Figure 3. LoRa monitoring architecture for livestock barns with local gateways and cloud backhaul.

    4. Install the LoRa Network for Reliable Barn Coverage

    A LoRa deployment should be commissioned as a radio network, not as a collection of independent sensors. Mount the gateway where it has a clear path toward the sensor field, preferably above large metal obstacles and away from electrical cabinets, motors and dense structural steel when practical. A central elevated position often works better than a low gateway mounted beside the farm office router.

    Install sensor housings so air can reach the sensing element while animals and cleaning equipment cannot. Use brackets, guards or protective locations that do not trap stagnant air around the sensor. Cable entries and external probes should be routed away from chewing, abrasion, pressure washing and manure contact. Where condensation is expected, use drip loops and keep connectors out of water paths. IP ratings reduce environmental risk but do not eliminate the need for suitable installation practice.
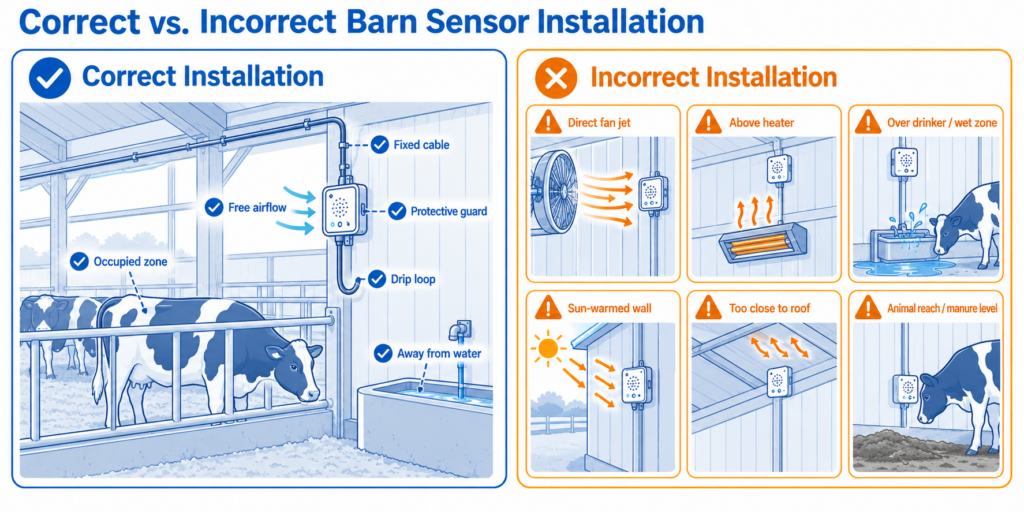
    Correct and incorrect temperature and humidity sensor installation in livestock barns.

    Figure 4. Correct and incorrect temperature and humidity sensor installation in livestock barns.

    After physical installation, test every point in its final location. Confirm that the gateway receives the sensor repeatedly over several reporting cycles and that records reach the cloud with the correct timestamp. Then test the weakest expected conditions: doors closed, curtains changed, fans running, equipment parked in normal positions and, for multi-building sites, the longest cross-building path. A network that works only during installation is not commissioned.

    Where one gateway cannot provide stable coverage, improve gateway placement before simply increasing transmit frequency or adding repeaters. Large farms may be better served by separate gateways for distant barns, each connected through Ethernet, Wi-Fi or 4G. This creates smaller radio cells and simplifies fault isolation. The gateway and node naming structure should reflect the farm layout, for example: Site – Barn – Zone – Pen/Row – Position.

    5. Configure the Cloud Platform Around Farm Response

    The cloud platform should tell farm staff what changed, where it changed and who must respond. Device grouping, sampling intervals, alarm thresholds, escalation rules and user permissions should be configured before routine use. Leaving default settings in place usually produces either too many nuisance alerts or too little information during a real event.

    Create groups that match the operation: farm, barn, animal group, production stage and responsibility. Use the same identifiers on the physical sensor label and in the platform. Sampling should be frequent enough to capture ventilation or heating failures but not so fast that normal short-term fluctuations create excessive data. Upload frequency can be different from measurement frequency if the device and architecture support it; local storage is valuable because a temporary radio or internet outage should not become a permanent data gap.
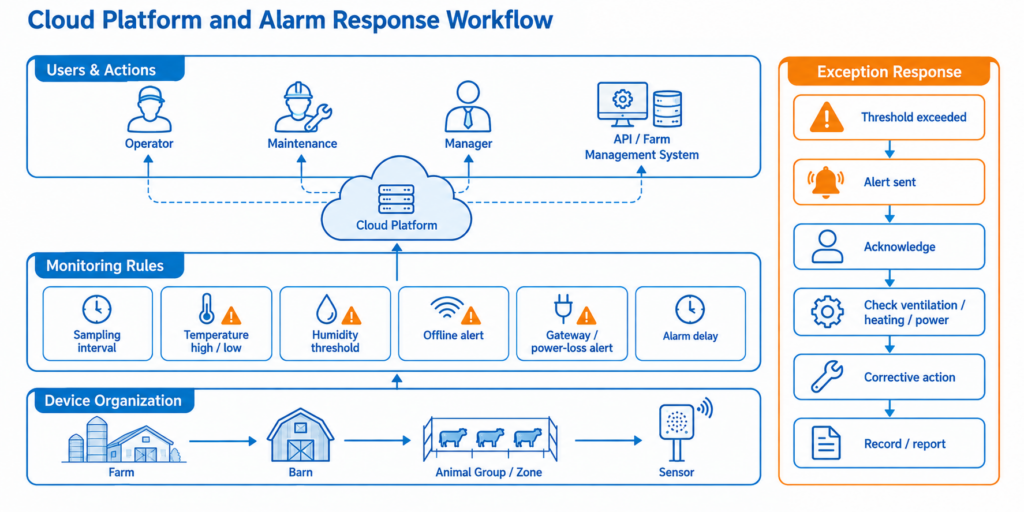
    Cloud platform configuration and alarm workflow for livestock barn monitoring.

    Figure 5. Cloud platform configuration and alarm workflow for livestock barn monitoring.

    Alarm limits should come from the farm’s approved husbandry or veterinary criteria for the specific animals, not from a generic internet chart. WOAH guidance shows why this matters: heat-stress risk in cattle depends on temperature, relative humidity, wind speed, animal density, shade and animal factors, while pigs also require ventilation without harmful draughts and protection from sudden thermal changes. A temperature alarm is therefore most useful when it is paired with knowledge of airflow, humidity and the animal group involved. [2-3]

    A practical alarm workflow usually needs a high temperature condition, a low temperature condition where relevant, an excessive humidity condition if the farm has an approved limit, an offline-device alert and a gateway or power-loss alert. Add a delay only when the farm can justify it from normal operating events. A brief door opening or heater start-up should not necessarily wake the entire management team, but a delay that is too long can hide a ventilation failure during hot weather.

    Access control should reflect roles. Operators may need live status and alarm acknowledgement, maintenance staff may need device health and battery status, and managers may need trends and reports across several barns. If farm data are integrated into a BMS, PLC, farm-management platform or data warehouse through an API, test timestamps, units, missing-data behavior and device replacement before relying on the integration for decisions.

    6. Commission, Maintain and Scale the Monitoring System

    Commissioning should test the complete chain from sensing to response. A plausible temperature on a dashboard is not enough. Compare each permanent point with a reference instrument under stable conditions, trigger at least one controlled alarm, interrupt network communication to verify local data retention, and confirm that missing records are transmitted with their original timestamps after the connection returns.
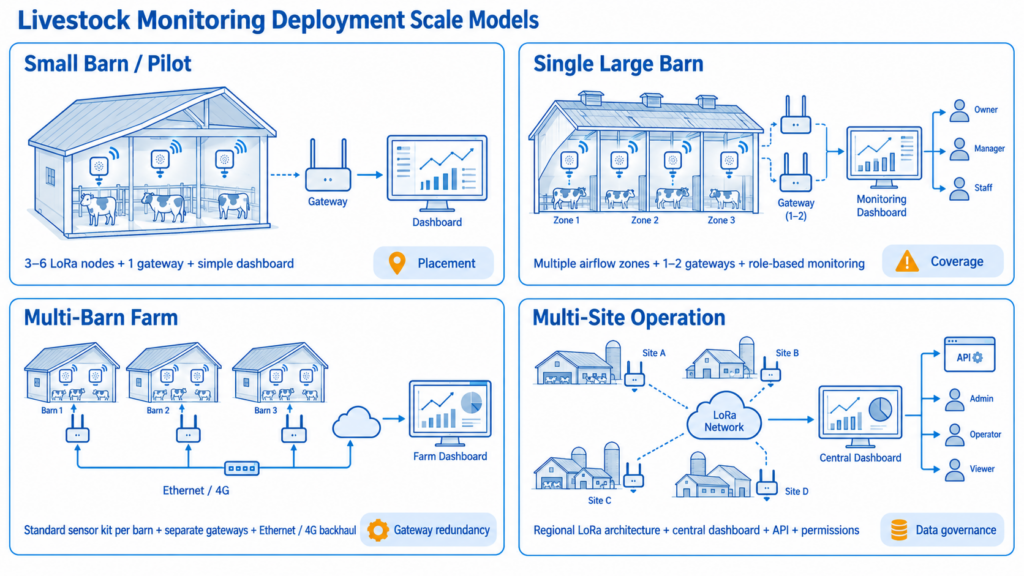
    Monitoring architectures for small barns, large barns, multi-barn farms, and multi-site operations.

    Figure 6. Monitoring architectures for small barns, large barns, multi-barn farms, and multi-site operations.

    Document the device ID, location, mounting height, reference check, radio result, power source, alarm settings and responsible contact for every point. Re-check the system after major seasonal ventilation changes, barn remodeling, fan replacement, new curtains, stocking-density changes or repeated unexplained environmental differences. Dust accumulation on housings and filters, damaged cables, weak batteries and altered airflow can all change system performance over time.
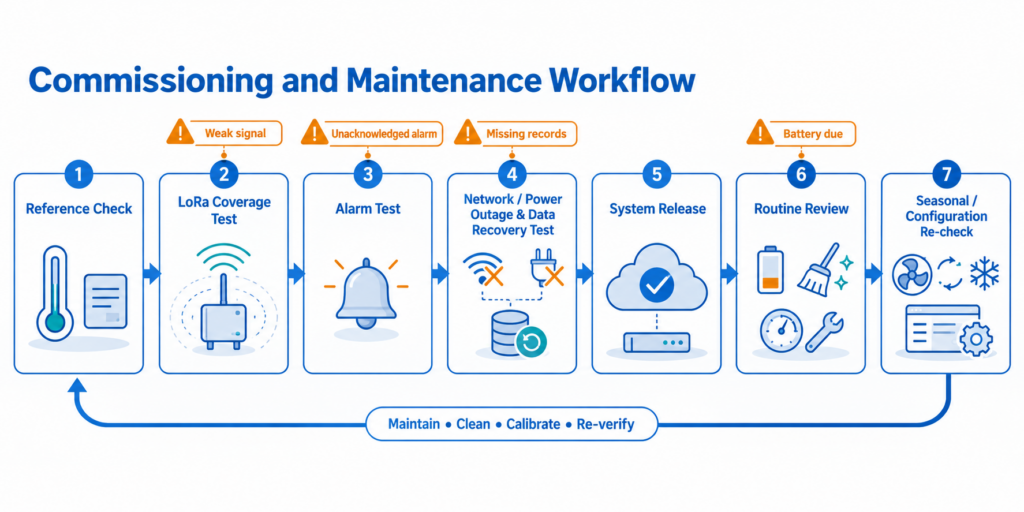
    Commissioning and maintenance workflow for a livestock barn monitoring system.

    Figure 7. Commissioning and maintenance workflow for a livestock barn monitoring system.

    Deployment scale Typical architecture Platform approach Main implementation concern
    Small barn or pilot 3-6 representative LoRa nodes and one gateway; local display only where useful. Single farm dashboard with a small alert group. Correct placement, proving coverage and avoiding nuisance alarms.
    Single large barn Multiple zones along airflow and animal areas; one or more gateways based on survey. Barn groups, role-based access, battery/offline monitoring and trend review. Radio shadows, seasonal ventilation modes and maintenance access.
    Multi-barn farm Standard sensor kit per barn; separate gateways where distance or structures require it; Ethernet or 4G backhaul. Central farm account, templates and consistent naming across barns. Gateway redundancy, cross-building coverage, maintenance consistency.
    Multi-site livestock operation Standardized LoRa architecture by region, local gateways, controlled API integration. Central or regional dashboards with permissions and reporting. Frequency-band compliance, cellular coverage, data governance and service response.

    7. Verified Product Comparison for Livestock Barn Deployment

    The products below represent different deployment routes rather than four identical devices. The comparison uses current official product pages or current manufacturer data sheets. Where a current source does not publish a value, the table states “Not publicly specified” instead of estimating it.

    Comparison item UbiBot DC1-L-TH + GW1/GW1-O Monnit ALTA MNS2-9-W2-HU-RH + gateway Sensaphone Sentinel Pro + FGD-0110 E+E EE071 + third-party Modbus host
    Deployment model LoRa T/RH node to UbiBot gateway; gateway backhaul by Wi-Fi/Ethernet or 4G depending model. Sub-GHz ALTA wireless T/RH sensor to Monnit gateway and iMonnit. Central cloud-connected monitoring panel with wired Modbus temperature/humidity sensor. Industrial RS485/Modbus probe requiring a separate gateway, PLC, BMS or cloud host.
    Temperature range -20 to 60°C. Not publicly specified on current product page. 0 to 50°C for FGD-0110. -40 to 80°C Modbus output range.
    Temperature accuracy ±0.2°C from 0 to 60°C. Not publicly specified on current product page. ±0.2°C. Use official accuracy curve; current data sheet does not express one single text value.
    Humidity range 0 to 100% RH; device operating environment 10-90% RH non-condensing. Relative humidity monitoring; exact measurement range not stated on the current SKU page. 0 to 100% RH, non-condensing. 0 to 100% RH.
    Humidity accuracy ±2% RH from 10 to 90% RH. ±3% RH across 10-90% RH on Monnit’s current product-family page. ±2% RH. ±2% RH from 0-90% RH; ±3% RH from 90-100% RH.
    Communication LoRa node; GW1 supports Wi-Fi/Ethernet, and GW1 cellular model adds 4G. ALTA regional sub-GHz radio to a separate gateway. Ethernet or cellular Sentinel Pro; Modbus RTU/RS485 to FGD-0110. RS485 / Modbus RTU.
    Local/offline data DC1-L-TH stores up to 50,000 records; GW1 stores up to 300,000 records. Exact local sensor buffer not publicly specified on current SKU page. Unlimited samples stored on Sentinel Pro servers; local sensor buffering not publicly specified. No onboard cloud logging; storage depends on the connected host.
    Power 4 x AA, lithium options, or DC 12 V for DC1-L-TH; gateway uses fixed power. 2 x AA; line-power option with battery backup available. FGD-0110 requires 20-28 VAC/DC; Sentinel Pro uses plug-in power with 8-hour battery backup. 4-28 V DC.
    Environmental protection DC1-L-TH ABS enclosure; GW1-O gateway is IP65. Confirm protection needed at each barn point. Standard AA enclosure for this SKU; industrial enclosure options exist elsewhere in ALTA family. FGD-0110 is specified for clean, dry indoor use; cellular Sentinel Pro is available in weatherproof NEMA 4X enclosure. IP65 probe with coated sensing element and sealed solder pads.
    Platform & alerts UbiBot cloud/app, alerts, history, local storage and API; on-premises options available in UbiBot ecosystem. iMonnit cloud monitoring and alerting through the Monnit gateway ecosystem. Sensaphone cloud, unlimited email/text/voice notifications, reports and Modbus integration. No native cloud platform; capabilities depend on the selected Modbus host.
    Best deployment fit Barns needing low-cabling LoRa coverage, multiple nodes and flexible Ethernet/4G gateway backhaul. Sites already standardized on Monnit ALTA and iMonnit with regional sub-GHz gateways. Facilities that need a central alarm panel, wired sensors, Modbus equipment integration and voice/text escalation. Harsh agricultural or stable environments where a robust industrial Modbus probe is integrated into an existing control system.

    The UbiBot architecture is the least wiring-intensive option in this comparison when the farm wants several wireless points and can place one gateway to cover the barn. Local storage at both the node and gateway levels is useful in rural sites where internet service is not always stable. The important project checks are real radio coverage, physical protection at the sensor point, regional frequency selection and the exact gateway backhaul available at the farm.

    Monnit follows a similar wireless architecture but uses the ALTA ecosystem and iMonnit. Sensaphone represents a panel-centric route: it is attractive when a farm wants to bring temperature, humidity, equipment contacts and third-party Modbus devices into one alarm system, but it involves more wiring and the FGD-0110 sensor itself is specified for clean, dry indoor use. E+E EE071 is a robust industrial probe that is explicitly listed for agriculture and stables; it is a strong field sensor but depends on another system for networking, dashboards and alerts. [8-11]

    8. Frequently Asked Questions

    Where should temperature and humidity sensors be placed in a livestock barn?

    Place representative sensors in or close to the animals’ occupied zone where they can measure normal barn air. Avoid direct fan jets, inlets, heaters, sun-warmed surfaces, drinker spray and manure channels unless that location is intentionally being monitored as a specific risk point.

    How many sensors does a livestock barn need?

    There is no reliable universal number based only on floor area. Barn length, animal zones, ventilation pattern, stocking density, height, cooling or heating equipment and repeated temperature differences should determine the count. Large houses normally need multiple points along the airflow path rather than one central sensor.

    Is LoRa suitable for livestock barn monitoring?

    Yes, LoRa can reduce cabling and cover many sensor points with one gateway, but actual coverage must be tested in the finished barn. Steel cladding, machinery, walls, elevation and distance between barns can reduce range. Multi-building farms may require more than one gateway.

    Should livestock barns monitor humidity as well as temperature?

    Usually yes when humidity affects animal comfort, bedding condition, condensation or ventilation performance. However, the alarm limit should come from species- and farm-specific operating criteria, not from a generic dashboard default.

    What happens if the farm internet connection fails?

    The field architecture should continue recording locally for the required outage period. After connectivity returns, stored data should be uploaded with their original timestamps. The commissioning test should verify this behavior rather than assume it.

    How should barn temperature alarms be configured?

    Use approved husbandry, veterinary or production criteria for the specific species and production stage. Configure high and low limits where relevant, then add justified delays and escalation rules so staff can distinguish short operational events from sustained heating or ventilation failures.

    How often should farm environmental sensors be checked or calibrated?

    Define the interval from manufacturer guidance, farm QA requirements, risk and observed drift. Accuracy should also be checked after damage, heavy wash-down exposure, unexplained differences, sensor replacement or major changes in the barn environment.

    Can barn sensor data be integrated with ventilation or farm-management systems?

    Yes when the selected platform or gateway exposes the required API or industrial interface. Integration should be tested for units, timestamps, missing data, device replacement and alarm ownership before the farm depends on automated decisions.

    A dependable livestock barn monitoring deployment starts with the animal environment, not the device catalog. Survey the barn, establish representative points, test radio coverage in real operating conditions, configure alarms around a documented response process, and commission the full path from sensor to notification. LoRa can be particularly effective where long buildings, multiple barns or limited cabling make conventional wired monitoring difficult.

    For a current UbiBot LoRa deployment, the DC1-L-TH with GW1 or GW1-O provides a verifiable path for distributed temperature and humidity monitoring, local data continuity and flexible gateway backhaul. Projects that require local displays, external probes or additional environmental variables can extend the architecture with other current UbiBot LoRa devices. The final design should still be approved against species-specific operating criteria, local regulations, farm IT constraints and the physical conditions of each barn.

    Product and Regulatory Sources

    [1] WOAH Terrestrial Animal Health Code, Chapter 7.1 – Introduction to animal welfare recommendations. Official source

    [2] WOAH Terrestrial Animal Health Code, Chapter 7.11 – Dairy cattle production systems. Official source

    [3] WOAH Terrestrial Animal Health Code, Chapter 7.13 – Pig production systems. Official source

    [4] UbiBot DC1-L-TH official product specification. Official source

    [5] UbiBot GW1 official product specification. Official source

    [6] UbiBot GW1-O official product specification. Official source

    [7] UbiBot WS1 Pro-L official product specification. Official source

    Related Resources

    How to Build a Server Room Temperature and Humidity Monitoring System?
    What Is an Environmental Monitoring System and How Does It Work?
    UbiBot vs Eupry vs Dickson vs ELPRO: Which Remote Temperature Monitoring System Fits Your Site?
    University of Alberta Study Uses UbiBot WS1 Pro to Monitor Environmental Conditions in Hydroponic Lettuce Production
    Shanghai Jiao Tong University and National University of Singapore Study Use UbiBot GS1-AETH1RS for Vertical Farming Environment Monitoring
    Polish Academy of Sciences Study Uses UbiBot WS1 Pro to Monitor Temperature and Humidity During PM Filter Conditioning
    University of Cambridge Study Uses UbiBot WS1 for Perishable Food Supply Chain Monitoring in an Autonomous Supply Chain Prototype
    University of Amsterdam Study Uses UbiBot WS1 to Monitor Indoor Environment During a COVID-19 Social Distancing Art Fair Experiment
    menu-header-svg
    Search
    • Explore Knowledge
      • Comparison & Selection
      • Industry Solution
      • Product & Device
      • Criterion & Compliance
      • Deployment & Usage
      • Technology & Principle
    • Academic Research
    • In-depth Tech

    Deployment & Usage

    See More >>

    Livestock Barn Temperature Monitoring Deployment Guide

    Published: September 7, 2026

    Updated: September 8, 2026

    By Jimmy Lianson

    Key Takeaway

    Plan barn monitoring around the animals’ occupied zone and airflow, not around convenient wall space. A dependable system combines representative temperature and humidity sensing, tested LoRa coverage, local data continuity, actionable alarms, and a maintenance process that survives dust, moisture, power loss, and changing barn conditions.

    Livestock barn temperature monitoring becomes an implementation problem as soon as a farm decides to move from periodic checks to continuous records. The difficult questions are practical: where should sensors sit relative to the animals, how many points are needed across pens or houses, how should data cross long metal-sided buildings, and what happens when power or internet access fails? A system that produces attractive cloud charts but misses the animal-level microclimate can give a false sense of control.

    The deployment also has to reflect species, age, stocking density, bedding, ventilation design, climate, and production stage. The World Organisation for Animal Health (WOAH) states that, for housed animals, air quality, temperature and humidity should support good animal health and welfare. Its species-specific guidance for dairy cattle and pigs further links thermal risk to temperature, relative humidity, airflow, stocking density and other animal factors. These principles are useful for system design, but they do not create one universal alarm threshold for every barn. Farm SOPs, veterinary guidance, production standards and local legal requirements should define the actual limits used in the monitoring platform. [1-3]

    1. Survey the Barn Before Selecting Sensors

    A pre-deployment survey should describe the barn as an environmental system. Record the animal zones, ventilation paths, heat and moisture sources, seasonal operating modes, network constraints and maintenance access before deciding how many devices to buy. This prevents a common failure: installing sensors where power and mounting are convenient rather than where the animals actually experience thermal stress.

    Pre-deployment survey points for a livestock barn monitoring project.

    Figure 1. Pre-deployment survey points for a livestock barn monitoring project.

    Start with the occupied zone. Note where animals rest, feed, drink, crowd, enter and leave, and whether young animals, sick animals or high-producing animals occupy separate areas. In mechanically ventilated barns, document fan banks, inlets, curtains, tunnel-ventilation direction, evaporative cooling pads, heaters and control sensors. In naturally ventilated structures, note prevailing wind direction, ridge openings, sidewalls and areas where airflow can be blocked by adjacent buildings or stored materials.

    The survey should also identify local environmental drivers that can distort a reading. Direct solar load near translucent roof panels, radiant heat from heaters, cold air near open doors, moisture above drinkers, manure channels, bedding packs and wash-down areas can all create local conditions that differ from the average barn. These locations may deserve dedicated risk sensors, but they should not automatically be used as the only representative points for the whole facility.

    Complete the communications survey at the same time. Test radio coverage with doors, curtains and metal partitions in their normal positions, not only in an empty building. Confirm where a LoRa gateway can be mounted above obstructions, whether Ethernet or Wi-Fi is available at that gateway, whether cellular backhaul is needed for remote farms, and where protected power can be supplied. If the site has several barns, measure the real path between buildings rather than assuming an advertised outdoor range will apply through walls, equipment and terrain.

    2. Plan Monitoring Points Around Animals and Airflow

    The main sensor should measure the air the animals experience. That usually means placing temperature and humidity sensors within or close to the occupied zone while protecting them from contact, chewing, dust loading, wash-down, direct heater radiation and concentrated airflow from fans or inlets. Sensor height should follow the species and housing layout rather than a standard eye-level mounting rule.

    In a long poultry or pig building, front-to-back conditions can differ because ventilation air enters, mixes, gains heat and moisture, and then exits. A practical starting layout is to place representative points near the air-entry region, the central animal area and the downstream or exhaust region. Additional points are justified where the house contains different animal groups, significant height changes, cooling pads, heaters or recurring wet zones. Large dairy barns may need points in resting areas, holding pens and other high-density locations, particularly where fans or sprinklers create different microclimates.

    Representative sensor placement based on animal occupied zones and airflow

    Figure 2. Representative sensor placement based on animal occupied zones and airflow.

    Avoid mounting a representative sensor directly in a fan jet, at an inlet, against a sun-warmed wall, above a heater, immediately over a drinker or manure channel, or so close to the roof that it mainly measures stratified hot air. A separate sensor can intentionally monitor those locations when the risk itself is important. The distinction is between a representative point used to describe the animals’ environment and a diagnostic point used to explain why that environment is changing.

    For new projects, begin with more temporary measurements than the final permanent network. Run sensors through typical day/night cycles and, where possible, across both warm and cold operating modes. Compare locations during fan-stage changes, curtain movement, feeding, wash-down and periods of high animal density. Permanent points should be selected from repeated patterns, not from a single afternoon survey.

    3. Choose the Sensor, Power and Network Architecture

    The best architecture separates three decisions: what must be measured, how the field device survives the barn, and how the data reaches the platform. Temperature and humidity are the core variables for this article, but some farms may also need CO2, ammonia, light, pressure or equipment-status inputs. Each additional variable should have a defined operational purpose before it is added to the system.

    The current UbiBot public catalog provides a LoRa architecture built around devices such as the DC1-L-TH temperature and humidity sensor and the GW1 or GW1-O LoRa gateway. The DC1-L-TH measures -20°C to 60°C with stated temperature accuracy of ±0.2°C from 0°C to 60°C, and 0% to 100% RH with stated humidity accuracy of ±2% RH from 10% to 90% RH. It stores up to 50,000 records locally, supports multiple battery options or DC 12 V power, and uses regional LoRa bands including EU868, US915, AU915, KR920, AS923 and IN865. [4]

    The UbiBot GW1 aggregates up to 100 LoRa nodes and can forward data to the UbiBot platform through 2.4 GHz Wi-Fi and Ethernet, with 4G available on the cellular version. UbiBot states an ideal outdoor LoRa range of up to 1 km; real barn coverage should still be tested because walls, steel cladding, machinery, elevation and terrain can reduce usable range. For gateways exposed to wet or dusty farm areas, the GW1-O provides an IP65 outdoor enclosure and supports Ethernet or 4G backhaul depending on model. [5-6]

    For barns where a local screen or external probes are valuable, the WS1 Pro-L is another current UbiBot LoRa option. It supports LoRa uplink, local storage for up to 50,000 records, four AA batteries or 5 V power, a 4.4-inch display, and external sensor interfaces. The most appropriate combination depends on whether the project needs a compact fixed node, local display, external probes, or additional environmental channels. [7]

    Power deserves the same attention as sensing. Battery operation reduces installation work, but battery life depends on reporting interval, radio quality, temperature and battery chemistry. Fixed gateway locations should normally use protected continuous power, and remote farms should define what happens during utility outages. If an environmental alarm matters during a blackout, the sensor, gateway, internet path and notification system all need an outage strategy; backing up only one component is not enough.

    LoRa monitoring architecture for livestock barns with local gateways and cloud backhaul.

    Figure 3. LoRa monitoring architecture for livestock barns with local gateways and cloud backhaul.

    4. Install the LoRa Network for Reliable Barn Coverage

    A LoRa deployment should be commissioned as a radio network, not as a collection of independent sensors. Mount the gateway where it has a clear path toward the sensor field, preferably above large metal obstacles and away from electrical cabinets, motors and dense structural steel when practical. A central elevated position often works better than a low gateway mounted beside the farm office router.

    Install sensor housings so air can reach the sensing element while animals and cleaning equipment cannot. Use brackets, guards or protective locations that do not trap stagnant air around the sensor. Cable entries and external probes should be routed away from chewing, abrasion, pressure washing and manure contact. Where condensation is expected, use drip loops and keep connectors out of water paths. IP ratings reduce environmental risk but do not eliminate the need for suitable installation practice.

    Correct and incorrect temperature and humidity sensor installation in livestock barns.

    Figure 4. Correct and incorrect temperature and humidity sensor installation in livestock barns.

    After physical installation, test every point in its final location. Confirm that the gateway receives the sensor repeatedly over several reporting cycles and that records reach the cloud with the correct timestamp. Then test the weakest expected conditions: doors closed, curtains changed, fans running, equipment parked in normal positions and, for multi-building sites, the longest cross-building path. A network that works only during installation is not commissioned.

    Where one gateway cannot provide stable coverage, improve gateway placement before simply increasing transmit frequency or adding repeaters. Large farms may be better served by separate gateways for distant barns, each connected through Ethernet, Wi-Fi or 4G. This creates smaller radio cells and simplifies fault isolation. The gateway and node naming structure should reflect the farm layout, for example: Site – Barn – Zone – Pen/Row – Position.

    5. Configure the Cloud Platform Around Farm Response

    The cloud platform should tell farm staff what changed, where it changed and who must respond. Device grouping, sampling intervals, alarm thresholds, escalation rules and user permissions should be configured before routine use. Leaving default settings in place usually produces either too many nuisance alerts or too little information during a real event.

    Create groups that match the operation: farm, barn, animal group, production stage and responsibility. Use the same identifiers on the physical sensor label and in the platform. Sampling should be frequent enough to capture ventilation or heating failures but not so fast that normal short-term fluctuations create excessive data. Upload frequency can be different from measurement frequency if the device and architecture support it; local storage is valuable because a temporary radio or internet outage should not become a permanent data gap.

    Cloud platform configuration and alarm workflow for livestock barn monitoring.

    Figure 5. Cloud platform configuration and alarm workflow for livestock barn monitoring.

    Alarm limits should come from the farm’s approved husbandry or veterinary criteria for the specific animals, not from a generic internet chart. WOAH guidance shows why this matters: heat-stress risk in cattle depends on temperature, relative humidity, wind speed, animal density, shade and animal factors, while pigs also require ventilation without harmful draughts and protection from sudden thermal changes. A temperature alarm is therefore most useful when it is paired with knowledge of airflow, humidity and the animal group involved. [2-3]

    A practical alarm workflow usually needs a high temperature condition, a low temperature condition where relevant, an excessive humidity condition if the farm has an approved limit, an offline-device alert and a gateway or power-loss alert. Add a delay only when the farm can justify it from normal operating events. A brief door opening or heater start-up should not necessarily wake the entire management team, but a delay that is too long can hide a ventilation failure during hot weather.

    Access control should reflect roles. Operators may need live status and alarm acknowledgement, maintenance staff may need device health and battery status, and managers may need trends and reports across several barns. If farm data are integrated into a BMS, PLC, farm-management platform or data warehouse through an API, test timestamps, units, missing-data behavior and device replacement before relying on the integration for decisions.

    6. Commission, Maintain and Scale the Monitoring System

    Commissioning should test the complete chain from sensing to response. A plausible temperature on a dashboard is not enough. Compare each permanent point with a reference instrument under stable conditions, trigger at least one controlled alarm, interrupt network communication to verify local data retention, and confirm that missing records are transmitted with their original timestamps after the connection returns.

    Monitoring architectures for small barns, large barns, multi-barn farms, and multi-site operations.

    Figure 6. Monitoring architectures for small barns, large barns, multi-barn farms, and multi-site operations.

    Document the device ID, location, mounting height, reference check, radio result, power source, alarm settings and responsible contact for every point. Re-check the system after major seasonal ventilation changes, barn remodeling, fan replacement, new curtains, stocking-density changes or repeated unexplained environmental differences. Dust accumulation on housings and filters, damaged cables, weak batteries and altered airflow can all change system performance over time.

    Commissioning and maintenance workflow for a livestock barn monitoring system.

    Figure 7. Commissioning and maintenance workflow for a livestock barn monitoring system.

    Deployment scale Typical architecture Platform approach Main implementation concern
    Small barn or pilot 3-6 representative LoRa nodes and one gateway; local display only where useful. Single farm dashboard with a small alert group. Correct placement, proving coverage and avoiding nuisance alarms.
    Single large barn Multiple zones along airflow and animal areas; one or more gateways based on survey. Barn groups, role-based access, battery/offline monitoring and trend review. Radio shadows, seasonal ventilation modes and maintenance access.
    Multi-barn farm Standard sensor kit per barn; separate gateways where distance or structures require it; Ethernet or 4G backhaul. Central farm account, templates and consistent naming across barns. Gateway redundancy, cross-building coverage, maintenance consistency.
    Multi-site livestock operation Standardized LoRa architecture by region, local gateways, controlled API integration. Central or regional dashboards with permissions and reporting. Frequency-band compliance, cellular coverage, data governance and service response.

    7. Verified Product Comparison for Livestock Barn Deployment

    The products below represent different deployment routes rather than four identical devices. The comparison uses current official product pages or current manufacturer data sheets. Where a current source does not publish a value, the table states “Not publicly specified” instead of estimating it.

    Comparison item UbiBot DC1-L-TH + GW1/GW1-O Monnit ALTA MNS2-9-W2-HU-RH + gateway Sensaphone Sentinel Pro + FGD-0110 E+E EE071 + third-party Modbus host
    Deployment model LoRa T/RH node to UbiBot gateway; gateway backhaul by Wi-Fi/Ethernet or 4G depending model. Sub-GHz ALTA wireless T/RH sensor to Monnit gateway and iMonnit. Central cloud-connected monitoring panel with wired Modbus temperature/humidity sensor. Industrial RS485/Modbus probe requiring a separate gateway, PLC, BMS or cloud host.
    Temperature range -20 to 60°C. Not publicly specified on current product page. 0 to 50°C for FGD-0110. -40 to 80°C Modbus output range.
    Temperature accuracy ±0.2°C from 0 to 60°C. Not publicly specified on current product page. ±0.2°C. Use official accuracy curve; current data sheet does not express one single text value.
    Humidity range 0 to 100% RH; device operating environment 10-90% RH non-condensing. Relative humidity monitoring; exact measurement range not stated on the current SKU page. 0 to 100% RH, non-condensing. 0 to 100% RH.
    Humidity accuracy ±2% RH from 10 to 90% RH. ±3% RH across 10-90% RH on Monnit’s current product-family page. ±2% RH. ±2% RH from 0-90% RH; ±3% RH from 90-100% RH.
    Communication LoRa node; GW1 supports Wi-Fi/Ethernet, and GW1 cellular model adds 4G. ALTA regional sub-GHz radio to a separate gateway. Ethernet or cellular Sentinel Pro; Modbus RTU/RS485 to FGD-0110. RS485 / Modbus RTU.
    Local/offline data DC1-L-TH stores up to 50,000 records; GW1 stores up to 300,000 records. Exact local sensor buffer not publicly specified on current SKU page. Unlimited samples stored on Sentinel Pro servers; local sensor buffering not publicly specified. No onboard cloud logging; storage depends on the connected host.
    Power 4 x AA, lithium options, or DC 12 V for DC1-L-TH; gateway uses fixed power. 2 x AA; line-power option with battery backup available. FGD-0110 requires 20-28 VAC/DC; Sentinel Pro uses plug-in power with 8-hour battery backup. 4-28 V DC.
    Environmental protection DC1-L-TH ABS enclosure; GW1-O gateway is IP65. Confirm protection needed at each barn point. Standard AA enclosure for this SKU; industrial enclosure options exist elsewhere in ALTA family. FGD-0110 is specified for clean, dry indoor use; cellular Sentinel Pro is available in weatherproof NEMA 4X enclosure. IP65 probe with coated sensing element and sealed solder pads.
    Platform & alerts UbiBot cloud/app, alerts, history, local storage and API; on-premises options available in UbiBot ecosystem. iMonnit cloud monitoring and alerting through the Monnit gateway ecosystem. Sensaphone cloud, unlimited email/text/voice notifications, reports and Modbus integration. No native cloud platform; capabilities depend on the selected Modbus host.
    Best deployment fit Barns needing low-cabling LoRa coverage, multiple nodes and flexible Ethernet/4G gateway backhaul. Sites already standardized on Monnit ALTA and iMonnit with regional sub-GHz gateways. Facilities that need a central alarm panel, wired sensors, Modbus equipment integration and voice/text escalation. Harsh agricultural or stable environments where a robust industrial Modbus probe is integrated into an existing control system.

    The UbiBot architecture is the least wiring-intensive option in this comparison when the farm wants several wireless points and can place one gateway to cover the barn. Local storage at both the node and gateway levels is useful in rural sites where internet service is not always stable. The important project checks are real radio coverage, physical protection at the sensor point, regional frequency selection and the exact gateway backhaul available at the farm.

    Monnit follows a similar wireless architecture but uses the ALTA ecosystem and iMonnit. Sensaphone represents a panel-centric route: it is attractive when a farm wants to bring temperature, humidity, equipment contacts and third-party Modbus devices into one alarm system, but it involves more wiring and the FGD-0110 sensor itself is specified for clean, dry indoor use. E+E EE071 is a robust industrial probe that is explicitly listed for agriculture and stables; it is a strong field sensor but depends on another system for networking, dashboards and alerts. [8-11]

    8. Frequently Asked Questions

    Where should temperature and humidity sensors be placed in a livestock barn?

    Place representative sensors in or close to the animals’ occupied zone where they can measure normal barn air. Avoid direct fan jets, inlets, heaters, sun-warmed surfaces, drinker spray and manure channels unless that location is intentionally being monitored as a specific risk point.

    How many sensors does a livestock barn need?

    There is no reliable universal number based only on floor area. Barn length, animal zones, ventilation pattern, stocking density, height, cooling or heating equipment and repeated temperature differences should determine the count. Large houses normally need multiple points along the airflow path rather than one central sensor.

    Is LoRa suitable for livestock barn monitoring?

    Yes, LoRa can reduce cabling and cover many sensor points with one gateway, but actual coverage must be tested in the finished barn. Steel cladding, machinery, walls, elevation and distance between barns can reduce range. Multi-building farms may require more than one gateway.

    Should livestock barns monitor humidity as well as temperature?

    Usually yes when humidity affects animal comfort, bedding condition, condensation or ventilation performance. However, the alarm limit should come from species- and farm-specific operating criteria, not from a generic dashboard default.

    What happens if the farm internet connection fails?

    The field architecture should continue recording locally for the required outage period. After connectivity returns, stored data should be uploaded with their original timestamps. The commissioning test should verify this behavior rather than assume it.

    How should barn temperature alarms be configured?

    Use approved husbandry, veterinary or production criteria for the specific species and production stage. Configure high and low limits where relevant, then add justified delays and escalation rules so staff can distinguish short operational events from sustained heating or ventilation failures.

    How often should farm environmental sensors be checked or calibrated?

    Define the interval from manufacturer guidance, farm QA requirements, risk and observed drift. Accuracy should also be checked after damage, heavy wash-down exposure, unexplained differences, sensor replacement or major changes in the barn environment.

    Can barn sensor data be integrated with ventilation or farm-management systems?

    Yes when the selected platform or gateway exposes the required API or industrial interface. Integration should be tested for units, timestamps, missing data, device replacement and alarm ownership before the farm depends on automated decisions.

    A dependable livestock barn monitoring deployment starts with the animal environment, not the device catalog. Survey the barn, establish representative points, test radio coverage in real operating conditions, configure alarms around a documented response process, and commission the full path from sensor to notification. LoRa can be particularly effective where long buildings, multiple barns or limited cabling make conventional wired monitoring difficult.

    For a current UbiBot LoRa deployment, the DC1-L-TH with GW1 or GW1-O provides a verifiable path for distributed temperature and humidity monitoring, local data continuity and flexible gateway backhaul. Projects that require local displays, external probes or additional environmental variables can extend the architecture with other current UbiBot LoRa devices. The final design should still be approved against species-specific operating criteria, local regulations, farm IT constraints and the physical conditions of each barn.

    Product and Regulatory Sources

    [1] WOAH Terrestrial Animal Health Code, Chapter 7.1 – Introduction to animal welfare recommendations. Official source

    [2] WOAH Terrestrial Animal Health Code, Chapter 7.11 – Dairy cattle production systems. Official source

    [3] WOAH Terrestrial Animal Health Code, Chapter 7.13 – Pig production systems. Official source

    [4] UbiBot DC1-L-TH official product specification. Official source

    [5] UbiBot GW1 official product specification. Official source

    [6] UbiBot GW1-O official product specification. Official source

    [7] UbiBot WS1 Pro-L official product specification. Official source

    分享

    LinkedIn2

    Facebook2

    X

    Newsletter Signup

    Related Resources

    How to Build a Server Room Temperature and Humidity Monitoring System?
    What Is an Environmental Monitoring System and How Does It Work?
    UbiBot vs Eupry vs Dickson vs ELPRO: Which Remote Temperature Monitoring System Fits Your Site?
    University of Alberta Study Uses UbiBot WS1 Pro to Monitor Environmental Conditions in Hydroponic Lettuce Production
    Shanghai Jiao Tong University and National University of Singapore Study Use UbiBot GS1-AETH1RS for Vertical Farming Environment Monitoring
    Polish Academy of Sciences Study Uses UbiBot WS1 Pro to Monitor Temperature and Humidity During PM Filter Conditioning
    University of Cambridge Study Uses UbiBot WS1 for Perishable Food Supply Chain Monitoring in an Autonomous Supply Chain Prototype
    University of Amsterdam Study Uses UbiBot WS1 to Monitor Indoor Environment During a COVID-19 Social Distancing Art Fair Experiment
    menu-header-svg
    Search
    • Explore Knowledge
      • Comparison & Selection
      • Industry Solution
      • Product & Device
      • Criterion & Compliance
      • Deployment & Usage
      • Technology & Principle
    • Academic Research
    • In-depth Tech
    Enter Your Information

    Confirm

    Products

    Dashboards

    Support

    Purchase

    Company

    Smart Sensing

    UbiBot Web Console

    APP Download

    UbiBot Online Store

    News

    Smart Control

    UbiBot Space

    Product Docs & APIs

    Find Distributors

    Learn Hub

    Smart Video

    UbiBot On-Premises

    Helpdesk & FAQ

    Volume Pricing

    About Us

    LoRa Products

    Agency Web Console

    Video Center

    Contact Us

    Software & Platform


    Pricing


    Architecture

    External Sensors


    System Status

    Accessories


    Become a Distributor

    Global SIM


    Become an Affiliate

    Positioning System


    Products

    Dashboards

    Business Partners

    WS1

    UbiBot Web Console

    Volume Pricing

    WS1 Pro

    UbiBot Space

    Become a Distributor

    GS1

    UbiBot Support Desk

    Affiliates

    GS2

    Agency Web Console


    MS1


    SP1


    Accessories


    Docs

    Purchase

    Company

    Platform API

    Pricing

    News

    Q&A

    UbiBot Partners

    About us

    Privacy Policy

    Online Store

    Contact

    Terms of Service


    System Status

    Products

    Dashboards

    Smart Sensing

    UbiBot Web Console

    Smart Control

    UbiBot Space

    Smart Video

    UbiBot On-Premises

    LoRa Products

    Agency Web Console

    Software & Platform


    External Sensors


    Accessories


    Global SIM


    Positioning System


    Support

    Purchase

    APP Download

    UbiBot Online Store

    Product Docs & APIs

    Find Distributors

    Helpdesk & FAQ

    Volume Pricing

    Video Center


    Pricing


    Company

    News

    Learn Hub

    About Us

    Contact Us

    Architecture

    System Status

    Become a Distributor

    Become an Affiliate

    Language:
    English 日本語 (ベータ)  
    Language:

    English

    日本語 (ベータ)


    IoT Product Family:
    ubibotico     Wireless environmental sensing products and smart building solutions
    ubitrackico     UWB-based real-time indoor tracking solutions with 30cm accuracy

    IoT Product Family:

    ubibotico  Wireless environmental sensing products and smart building solutions
    ubitrackico  UWB-based real-time indoor tracking solutions with 30cm accuracy

    © 2013-2026 UbiBot.com. All rights reserved.

    Terms of Service | Privacy Policy | Compliance

    youtube facebook twitter