

UBiBot Logo
UBiBot Logo
  • UBiBot Logo
  • Home
  • Products

    NEW

  • Pricing
  • Support
  • About Us
  • Download
  • magnifying-glass  Search
  • magnifying-glass header-close
  • Sign in Sign in
    Public Web Console Public Web Console
    On-Premises App Center On-Premises App Center
  • Home
  • Products

    NEW

  • Pricing
  • Support
  • About us
  • Download
  •  Public Web Console
  •  On-Premises App Center
  • Where to Buy

Learn Hub

Explore Knowledge Academic Research In-depth Tech

Share

LinkedIn

Facebook

X (Twitter)

Newsletter Signup

Table of contents

    What Environmental Parameters Matter Beyond ISO Class in a Cleanroom?

    Published: September 23, 2026

    Update: September 23, 2026

    By Frank Hill

    An ISO cleanroom class tells you how many airborne particles are permitted at defined particle sizes. It does not, by itself, tell you whether temperature is stable, relative humidity is suitable for the process, pressure cascades are intact, airflow is behaving as intended, or the monitoring system can reconstruct an excursion after a network failure. ISO 14644-1 classifies air cleanliness by airborne particle concentration; other physical or chemical attributes have to be specified and controlled according to the process, facility design, product risk, and applicable industry requirements.

    For a quality engineer or cleanroom manager, the practical question is therefore broader: what environmental parameters should be monitored in a cleanroom, how should those parameters be measured, and which ones need continuous alarms rather than periodic qualification tests? This article separates classification from operational monitoring, explains the measurement chain, and compares several monitoring architectures used for distributed cleanroom points.

    What Environmental Parameters Should Be Monitored in a Cleanroom? 30-Second Answer
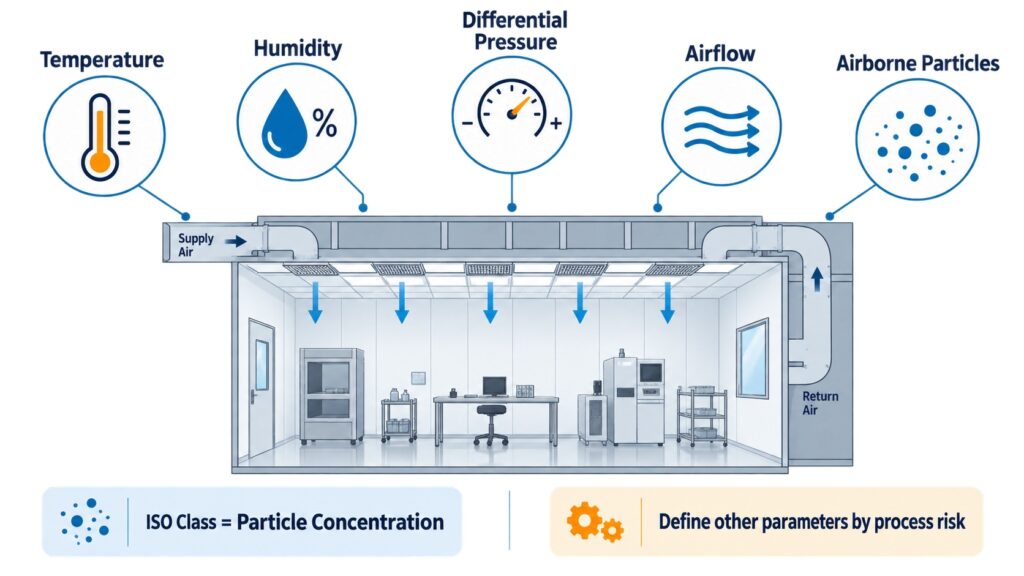
    Cleanroom environmental monitoring parameters beyond ISO class, including temperature, humidity, differential pressure, airflow, and airborne particles.what environmental parameters should be monitored in a cleanroom

    Beyond ISO class, a cleanroom should also monitor temperature, humidity, differential pressure, airflow, and process-relevant contaminants.

    User question Core conclusion
    Does ISO class cover all cleanroom conditions? No. ISO 14644-1 classifies airborne particle concentration. Temperature, humidity, pressure, airflow, chemical contamination, microbiological conditions and other attributes depend on the process and risk.
    Which parameters are commonly monitored continuously? Temperature, relative humidity and differential pressure are common facility parameters. Particle counts may also be continuous where process risk or regulation requires it.
    Is airflow velocity always a continuous sensor point? Not necessarily. Airflow velocity and visualization are often qualification or periodic verification tests; continuous airflow or fan status may be added when the process risk justifies it.
    Do all cleanrooms need microbial monitoring? No. Microbial environmental monitoring is application-specific, especially relevant to sterile or biocontamination-sensitive operations rather than every ISO-classified room.
    What matters beyond sensor accuracy? Range, uncertainty, drift, response time, calibration, placement, logging interval, local storage, alarm delay, time synchronization and data integrity all affect the usable result.
    What architecture works for distributed points? Wired analog/RS485, proprietary wireless, or mixed architectures can all work. Selection depends on cable access, point count, validation needs, network policy and integration requirements.

    Selection takeaway:

    define the process risks first, then assign each parameter a measurement location, sensor technology, alarm strategy, calibration method and data-retention requirement.

    Why ISO Class Alone Is Not Enough

    ISO 14644-1:2015 is deliberately narrow: it classifies cleanrooms and clean zones by airborne particle concentration, using light-scattering airborne particle counters at designated sampling locations. It does not characterize the viable, chemical or other nature of particles, and it does not prescribe universal temperature, humidity or room-pressure setpoints.

    ISO 14644-2:2015 then addresses a monitoring plan for demonstrating performance related to air cleanliness by particle concentration. ISO 14644-3:2019 provides test methods for cleanroom performance, while ISO 14644-4:2022 covers design, construction and start-up requirements. Together, these standards make an important distinction: classification is one controlled attribute, not a complete environmental-control specification.

    Application-specific rules can go further. EU GMP Annex 1 for sterile medicinal products, for example, distinguishes cleanroom qualification from operational environmental monitoring and identifies tests such as airflow measurement, air-pressure difference, airflow direction, microbial contamination, temperature, relative humidity, recovery and containment leak testing where relevant. FDA inspection guidance for sterile drug operations similarly expects pressure differentials, temperature and humidity to be monitored and excursions to be investigated. Those pharmaceutical expectations should not be copied into an electronics or precision-assembly cleanroom without a process-based rationale; they are examples of how industry risk changes the monitoring plan.

    What Does the Complete Cleanroom Monitoring Data Path Look Like?

    A useful monitoring architecture starts at the physical environment and ends with a record that can be reviewed after an event. The typical path is:

    Cleanroom condition -> sensor/transmitter -> signal conversion -> edge logger or gateway -> local memory -> facility network -> cloud or on-premises platform -> alarms, trends, reports and integration

    The sensor converts a physical condition into a measurable signal. A differential-pressure transmitter may output 4-20 mA or Modbus; a temperature/humidity probe may provide a digital RS485 signal; a particle counter may use Ethernet or a vendor protocol. The edge logger time-stamps the reading, applies configuration such as scaling or engineering units, and should retain data locally when the network is unavailable. The platform then provides trend views, alarms, user access, audit records, exports and integration into BMS, MES, LIMS or other quality systems.

    This separation matters because a network interruption should not automatically become a measurement gap. Local continuity, accurate clocks and controlled backfill are part of the measurement system, not merely IT conveniences.
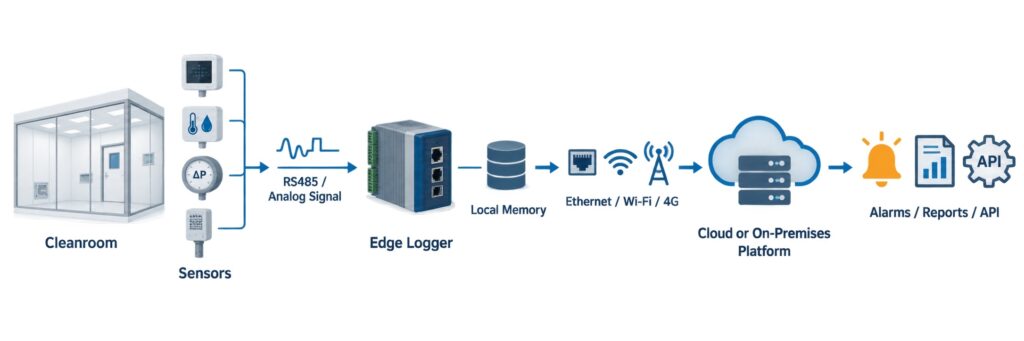
    Cleanroom monitoring data path from sensors and edge loggers through local memory and networks to cloud or on-premises platforms, alarms, reports, and APIs.

    Cleanroom monitoring is a complete data path from field sensors to local storage, network transport, and the monitoring platform.

    How the Core Measurements Work

    Temperature and relative humidity

    Temperature and relative humidity influence operator comfort, product behavior, static charge, moisture absorption, condensation risk and the stability of some processes. Electronic humidity probes commonly use capacitive sensing elements whose electrical capacitance changes with absorbed water vapor. Temperature is typically measured by an RTD, thermistor or semiconductor element. In a combined transmitter, the electronics convert these signals to calibrated engineering values and may transmit them digitally or through analog outputs.

    There is no universal cleanroom temperature or RH requirement in ISO 14644-1. The setpoint and alarm band must come from the process, product, gowning load, equipment heat, condensation/static risk and any sector-specific standard. A tighter display resolution does not automatically mean better accuracy, and a sensor specified at room conditions may not have the same uncertainty across the full operating range.

    Differential pressure

    Differential pressure is a proxy for the pressure cascade between rooms or zones. A differential-pressure sensor compares pressure at two ports and converts the small pressure difference to an electrical signal. The important engineering question is not only the sensor range, but whether the tubing, reference point, installation height, door operation and HVAC control strategy allow the reading to represent the intended pressure barrier.

    Pressure alarms usually need a delay or hysteresis because doors create short transients. A delay should filter expected events without masking a sustained loss of containment or protection. In sterile or high-risk operations, pressure trends and alarm history can be as important as the live display because they show whether the required cascade was maintained throughout production.
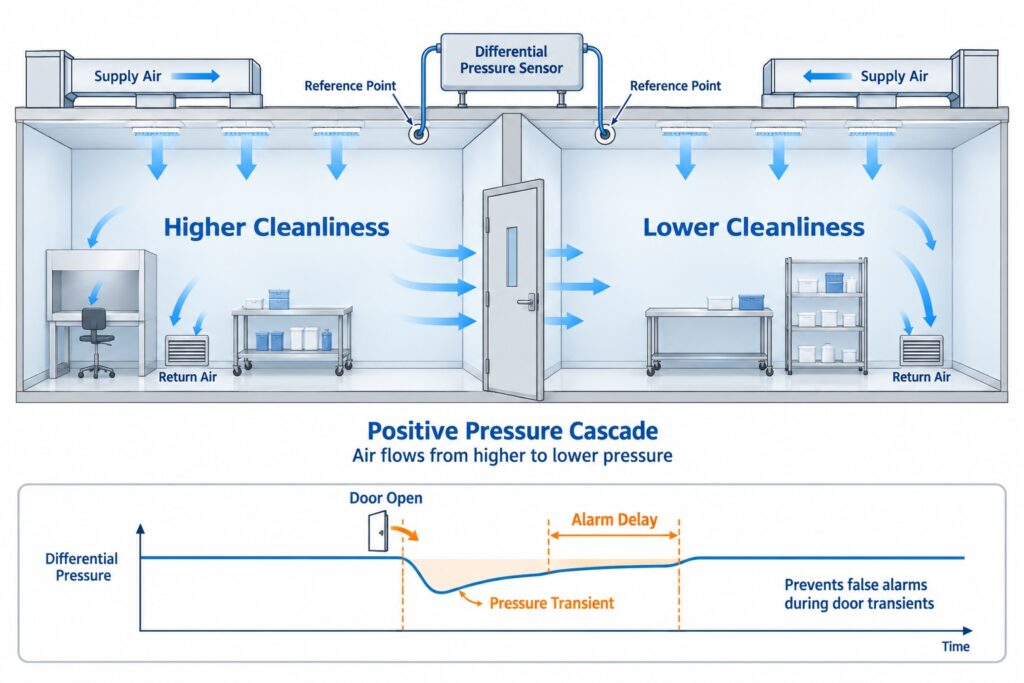
    Cleanroom differential-pressure cascade between higher- and lower-cleanliness rooms, showing pressure references, door transients, and alarm delay.

    Effective differential-pressure monitoring depends not only on sensor accuracy, but also on the reference point, door status, and alarm delay.

    Airflow, air-change performance and room recovery

    Airflow velocity, volume and direction explain how filtered air removes or displaces contamination. These attributes are often verified during qualification using calibrated anemometers, balometers and visualization methods. They are not always represented by one permanently installed sensor. Continuous monitoring may instead use fan status, duct pressure, airflow transmitters or BMS points when a loss of airflow creates a meaningful process risk.

    This distinction prevents over-instrumentation. A parameter can be critical to cleanroom performance without needing a permanent sensor at every location. Qualification tests establish performance; operational monitoring watches the parameters whose drift can indicate loss of control between qualification events.

    Airborne particles and process-specific contamination

    Airborne particle concentration is the basis of ISO classification and may also be monitored operationally in critical processes. The sampling strategy, particle sizes, locations and alert levels should reflect the room classification and process risk. Chemical contamination is separate: ISO 14644-8:2022 provides a framework for assessing air cleanliness by chemical concentration where airborne molecular contamination threatens the product or process. Semiconductor, optics and battery manufacturing may care about acids, bases, organics or specific gases that would be irrelevant in another cleanroom.

    Microbiological monitoring is also process-specific. Sterile pharmaceutical operations may require viable airborne and surface monitoring, while many industrial cleanrooms do not. The monitoring plan should therefore be built from contamination mechanisms, not from an assumption that every cleanroom needs every sensor type.

    Which Monitoring Architectures Are Commonly Used?
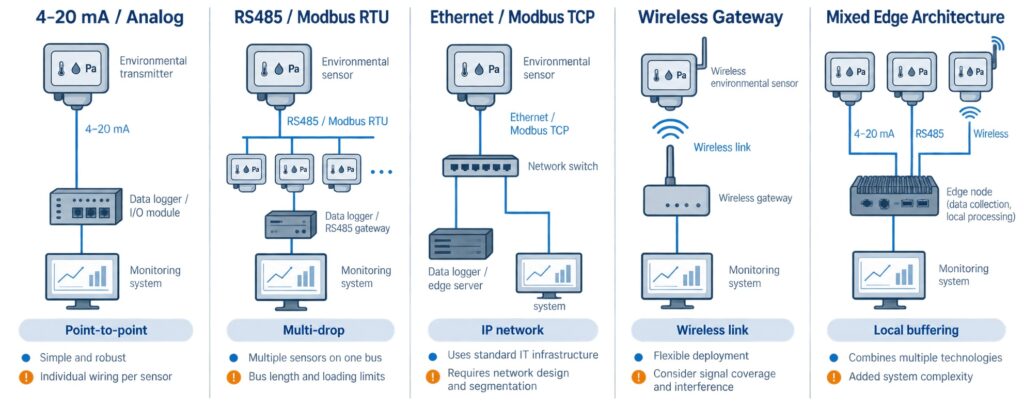
    Comparison of analog, RS485, Ethernet, wireless gateway, and mixed edge architectures for cleanroom environmental monitoring.

    Analog wiring, RS485, Ethernet, proprietary wireless, and mixed edge architectures each have distinct application boundaries.

    Architecture How it works Strengths Limits Typical fit
    Wired analog (4-20 mA / voltage) Transmitters feed analog input modules or PLC/BMS I/O. Mature, deterministic, easy to integrate with existing controls. More cabling; scaling and loop power must be managed. Fixed facilities with many existing industrial transmitters.
    RS485 / Modbus RTU Multiple digital transmitters share a serial bus using addresses. Multi-drop wiring, digital values, broad industrial sensor choice. Bus topology, termination, addressing and power need engineering. Distributed T/RH, pressure and multi-parameter points.
    Ethernet / Modbus TCP IP-connected devices or converters send data over LAN. Fits enterprise networks; direct BMS/SCADA integration. IT approval, switch capacity, cybersecurity and PoE design matter. Permanent cleanrooms with structured network infrastructure.
    Proprietary sub-GHz / LoRaWAN Wireless sensors transmit to dedicated gateways. Long range, less field wiring, flexible expansion. Requires RF planning, gateways and vendor ecosystem management. Retrofits, large campuses and difficult cable routes.
    Mixed edge architecture A local host combines RS485/analog/wireless inputs and forwards normalized data. Can consolidate heterogeneous sensors and provide local display/storage. Edge device becomes a critical design point; protocol compatibility must be verified. Sites needing flexible third-party integration and phased expansion.

    Which Technical Parameters Affect Real-World Monitoring?

    Measurement range comes first: the selected transmitter must cover normal operation and credible excursions without sacrificing useful resolution. Accuracy should be read together with its stated conditions, calibration uncertainty and long-term drift. Resolution only describes the smallest displayed or stored increment; it does not prove the measurement is correct to that increment.

    Response time affects alarms. A fast pressure sensor may reveal every door opening, while a slow sensor or long averaging window may hide a developing HVAC fault. Sampling and logging intervals determine the time resolution of the historical record. Alarm delays and hysteresis should be justified by process behavior rather than chosen only to reduce nuisance alarms.

    For networked systems, local storage capacity, backup power, clock synchronization, backfill behavior and communication-loss alarms determine whether data remains reconstructable. For regulated records, user roles, configuration history, audit trail scope, report generation and backup/restore controls become part of the system design. Calibration also needs a lifecycle: the probe or transmitter should be replaceable or removable without creating unnecessary downtime, and calibration points should cover the actual operating range.

    How Should Nearby Technologies Be Chosen?

    Parameter Typical technology Use when Key caution
    Temperature / RH Calibrated T/RH probe or transmitter Process-specific setpoint and alarm band Humidity location must avoid direct supply-air bias or condensation-prone mounting.
    Differential pressure Low-range differential-pressure transmitter Room-to-room or room-to-corridor cascade Tubing/reference placement and door transients can dominate the reading.
    Airflow Qualification instruments or permanent airflow/duct sensors Where airflow loss directly threatens process control Do not assume qualification airflow tests require permanent sensors everywhere.
    Airborne particles Light-scattering particle counter ISO classification and risk-based operational monitoring Sampling location, flow rate and tubing losses affect results.
    Chemical / gas contamination Process-specific gas or AMC sensor/analyzer Only where chemical contamination is a defined risk Select by target compound, detection limit, cross-sensitivity and response time.
    Door state / equipment status Dry contact, magnetic contact, BMS status point Correlating excursions with access or HVAC events Context signal, not a substitute for environmental measurement.

    Representative Cleanroom Monitoring Architectures Compared

    The systems below are not identical product forms. They are compared as complete monitoring architectures because cleanroom projects usually combine sensors, edge hardware, networking and software. Specifications are based on official manufacturer documentation reviewed in September 2026; where a public source did not define a universal limit, the table says so rather than estimating it.
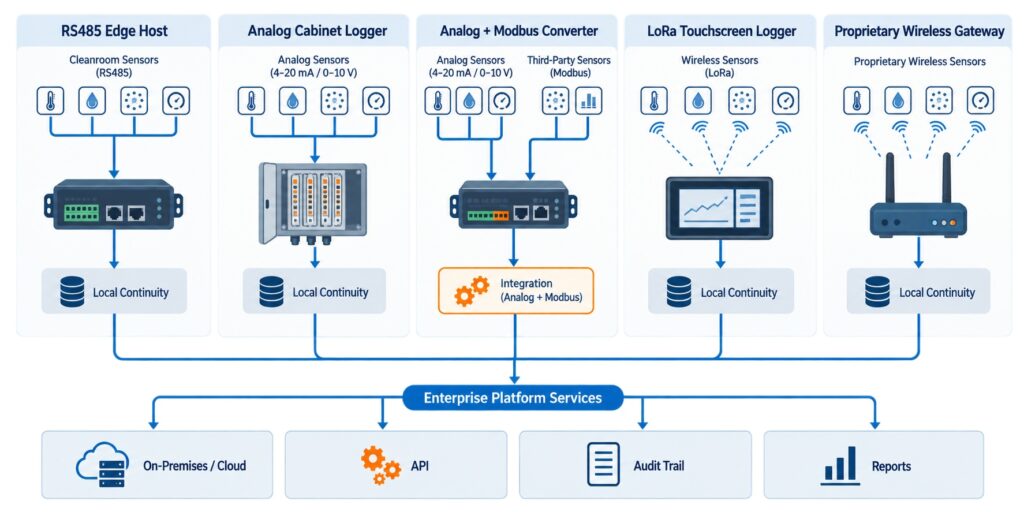
    Enterprise cleanroom monitoring architecture comparison across UbiBot, Vaisala, Rotronic, Dickson, and Monnit approaches.

    Enterprise cleanroom monitoring systems mainly differ in edge architecture, third-party sensor integration, local data continuity, and platform integration.

    System Edge architecture Sensor / network interfaces Local continuity / display Software / integration Typical fit
    UbiBot GS1-AETH1RS / GS1A-AL4G1RS + RS485 sensors + On-Premises GS1 edge host with built-in T/RH and RS485 external-sensor interface; 4-inch LCD. Public documentation does not state one universal maximum number of third-party RS485 nodes. RS485 Universal Sensor Converter supports compatible third-party RS485 query/response protocols; Ethernet model supports Wi-Fi + Ethernet/PoE option; 4G model supports Wi-Fi + cellular. 300,000 sensing records on GS1. Local display of configured channels. On-Premises platform can run without Internet. Public cloud or on-premises; HTTP/MQTT APIs, data forwarding, MySQL/API/script integration on OPP. Field-change audit-trail information is documented by UbiBot. Flexible mixed-sensor deployments where RS485 openness, local display, network choice and API integration matter. Verify external sensor calibration and protocol compatibility for each cleanroom point.
    Vaisala viewLinc ES 5.2 + CAB100 + DL4000 CAB100 industrial cabinet aggregates differential-pressure and analog channels; large CAB100B analog configuration supports up to 32 analog input channels. DL4000 supports up to four analog inputs per logger. Analog voltage/current inputs; Ethernet, Wi-Fi or vNet/PoE options depending configuration. Third-party analog transmitters can be integrated through CAB100/DL4000. DL4000 records at the measurement point with battery-backed autonomous memory; reviewed CAB100/DL4000 documents do not describe one built-in operator display for all channels. viewLinc Enterprise Server 5.2 is customer-hosted; alarms, reports, Active Directory support and OPC UA integration are available. Strong fit for regulated or enterprise environments needing mature validation, calibration and centralized monitoring workflows.
    Rotronic RMS On-Premise + RMS-ADC-L-R + RMS-CONVERTER-100 RMS-ADC-L-R provides two analog sensor inputs and stores 44,000 pairs of measured values. RMS-CONVERTER-100 integrates up to 100 measuring points. Analog 0/1/5/10 V and 0/4-20 mA through ADC logger; Modbus TCP and selected digital protocols through converter; third-party integration also possible through API. ADC logger has local memory; RMS-CONVERTER-100 provides 7 days of data logging. Optional RMS Display can show selected points. RMS software can run on customer SQL infrastructure; audit trail, reports, API, OPC UA options and GxP-oriented validation tooling are available. Useful where analog and Modbus TCP instrumentation must be integrated into a validated on-prem monitoring environment.
    Dickson OCEAView On-Premises + Cobalt X Cobalt X1 supports 2 simultaneous channels; X2 supports 4 simultaneous channels and up to four wireless sensors assigned. 2.4-inch touchscreen. Primarily Dickson Smart-Sensors plus Bluetooth/LoRaWAN. Connect Gateway provides Ethernet, Wi-Fi or 4G backhaul. Public docs reviewed emphasize Dickson sensor ecosystem rather than generic third-party sensors. Onboard memory; current Dickson comparison material lists 16,000 readings for Cobalt X. Local touchscreen supports alarm acknowledgement. OCEAView Cloud or On-Premises; long-range LoRaWAN gateway architecture, alarm workflows and calibration-aware Smart-Sensors. Good fit for life-science sites that value local touchscreen operation, replaceable calibrated sensors and LoRaWAN coverage.
    Monnit iMonnit Enterprise + ALTA EGW4 + ALTA sensors EGW4 supports up to 100 ALTA wireless sensors; iMonnit Enterprise licensing is offered by sensor count. Proprietary ALTA wireless network to Ethernet gateway. Modbus TCP and SNMP can expose sensor data to third-party systems; gateway unlock is required for some private-interface use cases. Current EGW4 firmware can retain up to 50,000 sensor messages during server/network outages and upload them later. Gateway itself has status LEDs rather than full measurement display. iMonnit Enterprise is installed on customer servers and supports alerts and CSV export; Monnit also documents REST API/webhook capabilities in its software ecosystem. Scalable wireless retrofit architecture where long-range battery sensors and simple Ethernet gateway deployment are priorities.

    The comparison shows different design philosophies rather than a single winner. Vaisala and Rotronic provide mature life-science monitoring ecosystems with strong validation and calibration tooling. Dickson emphasizes local touchscreen operation, replaceable Smart-Sensors and LoRaWAN-based monitoring. Monnit is especially scalable for proprietary long-range wireless sensor networks. UbiBot’s differentiator is architectural flexibility: GS1 can combine a local display, 300,000-record memory, Ethernet or cellular backhaul depending model, RS485 third-party sensor integration, APIs and an optional on-premises platform. That flexibility is useful when a cleanroom project needs to consolidate temperature, humidity, differential pressure or other Modbus points without forcing every measurement onto one proprietary sensor family.

    The trade-off is that an open architecture transfers more responsibility to the project team. Sensor accuracy, calibration, protocol mapping, power, bus design, alarm logic and validation evidence must be specified for the complete measurement channel. On-premises deployment also provides data-location control but does not automatically establish GxP or Part 11 compliance; the intended workflow still has to be assessed and validated where required.

    How Should Monitoring Differ by Cleanroom Application?

    Electronics and precision assembly cleanrooms

    Airborne particles remain central, but temperature and RH may be equally important to dimensional stability, static control, soldering, coating or optical processes. Chemical contamination may become critical for semiconductor or optics manufacturing. The monitoring plan should follow the process sensitivity, not a pharmaceutical template.

    Sterile pharmaceutical or aseptic areas

    Pressure cascades, temperature, humidity and non-viable particle monitoring are typically integrated with the facility monitoring strategy, while viable monitoring is addressed through the contamination-control program. EU GMP Annex 1 is a key application-specific reference. Alarm history, user roles, time synchronization, audit trails and investigation workflows become especially important because the data can support batch and deviation decisions.

    Medical-device and controlled assembly areas

    The required parameters depend on the product and contamination risks. Some operations need particle classification plus T/RH and pressure; others may require fewer continuous points but stronger periodic qualification. A risk assessment should define which environmental changes can affect product quality before sensors are selected.

    Laboratory clean zones and controlled rooms

    Small controlled rooms often benefit from a mixed architecture: one local edge host can collect T/RH and pressure while a particle counter remains on its own qualified schedule. This avoids overloading the system with unrelated instruments while still creating one operational alarm and trend view for facility conditions.

    Common Deployment Mistakes

    Using ISO class as a complete environmental specification

    ISO class defines particle concentration, not universal T/RH, pressure or microbial limits. The project URS should explicitly define each additional controlled parameter and why it matters.

    Selecting sensors before defining the measurement point

    A highly accurate sensor in a poor location still produces a poor process representation. Pressure reference points, probe height, supply-air influence, heat sources, door paths and operator zones should be defined before mounting hardware.

    Treating display resolution as accuracy

    A 0.01 display increment does not prove ±0.01 measurement performance. Procurement should compare stated accuracy or uncertainty under the intended range, calibration evidence, drift and recalibration method.

    Ignoring network and power failure behavior

    A platform can only reconstruct an excursion if measurements continue during the outage. Verify local memory, gateway buffering, backup power, time synchronization and the exact backfill sequence during commissioning.

    Applying the same alarm delay to every parameter

    Door-related pressure transients, slowly drifting humidity and particle excursions have different time behavior. Alarm delay and hysteresis should be parameter-specific and justified against process risk.

    Assuming on-premises equals compliant

    Local hosting answers a data-location and infrastructure-control question. Regulated use also requires access control, audit-trail scope, backup/restore, configuration control, validation, procedures and trained users.
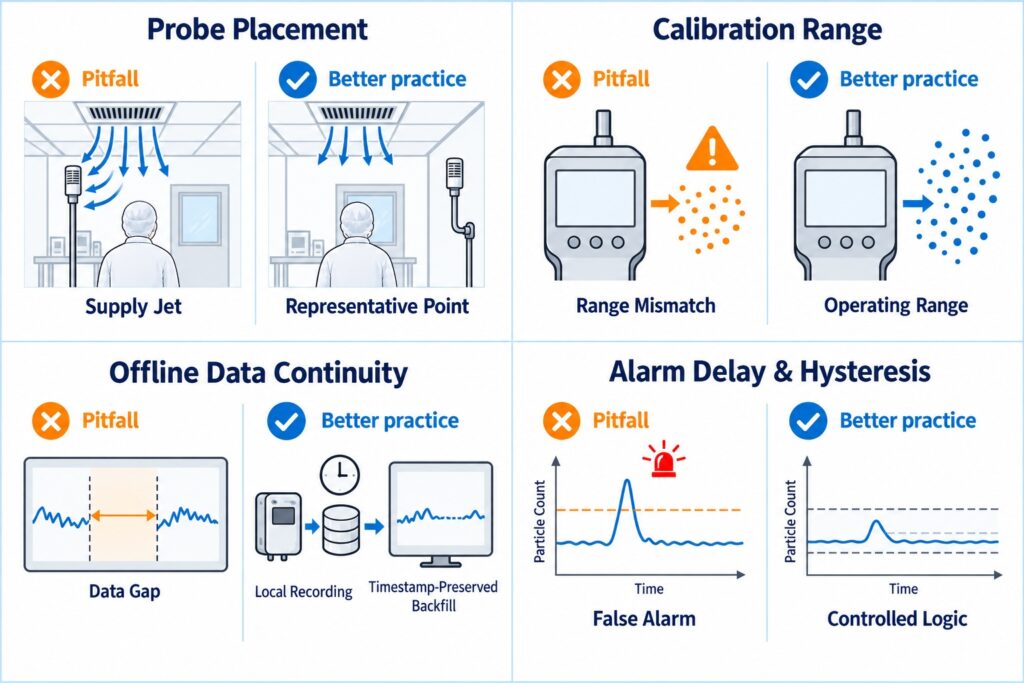
    Cleanroom monitoring deployment pitfalls involving sensor placement, calibration range, offline data continuity, and alarm delay logic.

    Sensor placement, calibration, offline continuity, and alarm logic together determine whether monitoring data can be trusted.

    Frequently Asked Questions

    What environmental parameters should be monitored in a cleanroom?

    At minimum, monitor the parameters that can affect product quality or contamination control. Common operational points include temperature, relative humidity and differential pressure. Airborne particles may be monitored continuously or periodically depending on the room and process. Airflow, microbial contamination, chemical contamination, door status and equipment state are added when the risk assessment or sector rules require them.

    Does ISO 14644 specify cleanroom temperature and humidity limits?

    ISO 14644-1 does not prescribe universal temperature or relative-humidity setpoints. It classifies air cleanliness by airborne particle concentration. T/RH limits should come from the product, process, equipment, operator requirements, contamination-control strategy and any applicable sector-specific standards.

    Should differential pressure be monitored continuously?

    Often yes when the room-to-room pressure cascade is a critical contamination-control barrier. Continuous trending and alarms can reveal sustained HVAC or door-related problems that a periodic reading would miss. The required alarm limit and delay should be defined from the facility design and process risk.

    Do all cleanrooms need continuous particle counters?

    No. ISO classification requires particle measurement, but continuous operational particle monitoring depends on the cleanroom grade, process risk and applicable regulation. Critical sterile zones commonly have more intensive particle monitoring than many industrial cleanrooms.

    Can one monitoring platform combine temperature, humidity and pressure sensors?

    Yes, if the platform and edge hardware support the required interfaces. Mixed systems may combine RS485/Modbus, 4-20 mA, voltage, Ethernet or proprietary wireless sensors. The key is to validate channel identity, scaling, calibration, time stamps and alarm behavior for each measurement point.

    What happens if the cleanroom monitoring network goes offline?

    A robust architecture continues to log measurements locally and uploads the missing data after connectivity returns. The exact behavior depends on the device and gateway. Commissioning should test network loss, power loss, buffer capacity, time synchronization, backfill and offline alarms.

    How often should cleanroom sensors be calibrated?

    There is no single universal interval. The calibration frequency should reflect sensor stability, manufacturer guidance, historical drift, process risk, regulatory expectations and the facility calibration program. The calibration range and points should cover the actual operating conditions.

    Conclusion

    What environmental parameters matter beyond ISO class in a cleanroom? The answer depends on what the cleanroom is protecting. ISO class describes airborne particle concentration, while operational control may also depend on temperature, humidity, pressure cascades, airflow behavior, chemical contamination, microbiological conditions and equipment status. Not every parameter needs a permanent sensor, but every critical parameter needs a defined measurement and verification strategy.

    For procurement, the sensor specification is only one layer. Location, calibration, local continuity, alarm design, data integrity and integration determine whether the system can support real decisions after an excursion. Enterprise platforms from Vaisala, Rotronic, Dickson and Monnit show different ways to solve this problem. UbiBot offers a flexible alternative based on GS1 edge hosts, RS485 sensor integration, local storage, multi-network connectivity, APIs and optional on-premises deployment. The correct architecture is the one that can represent the required cleanroom parameters with traceable measurements and recoverable records throughout the operating lifecycle.

    Source and Specification Note

    Standards and product specifications were reviewed in September 2026 from official standards bodies, regulatory agencies and manufacturer documentation. Product capabilities can change by hardware revision, region, firmware and software license. Where official public documentation did not state a universal capacity or feature, this article does not infer one. Application-specific limits should be confirmed in the project URS, current standard, current manufacturer datasheet and validation package before procurement or deployment.

    Official References

    [1] ISO 14644-1:2015 – Classification of air cleanliness by particle concentration. https://www.iso.org/standard/53394.html

    [2] ISO 14644-2:2015 – Monitoring to provide evidence of cleanroom performance. https://www.iso.org/standard/53393.html

    [3] ISO 14644-3:2019 – Test methods. https://www.iso.org/standard/60598.html

    [4] ISO 14644-4:2022 – Design, construction and start-up. https://www.iso.org/standard/72379.html

    [5] ISO 14644-8:2022 – Assessment of air cleanliness by chemical concentration. https://www.iso.org/standard/76890.html

    [6] EU GMP Annex 1 – Manufacture of Sterile Medicinal Products. https://health.ec.europa.eu/medicinal-products/eudralex/eudralex-volume-4_en

    [7] FDA – Sterile Drug Products Produced by Aseptic Processing. https://www.fda.gov/regulatory-information/search-fda-guidance-documents/sterile-drug-products-produced-aseptic-processing-current-good-manufacturing-practice

    [8] UbiBot GS1 specifications. https://www.ubibot.com/ubibot-gs1-specifications/

    [9] UbiBot On-Premises Platform. https://www.ubibot.com/on-premises-platform/

     

    Related Resources

    How to Select Temperature Monitoring Devices for Pharmaceutical Storage and Transport Under USP <1079.3>
    What EN 12830 Means When Selecting a Cold-Chain Temperature Recorder?
    Water Leak Detection for Data Centers and Warehouses
    Commercial Indoor Air Quality Monitors for CO2 PM2.5 TVOC and BMS Integration
    How to Monitor Temperature, Humidity and Differential Pressure in Medical Laboratories
    How Many Sensors Does a Greenhouse Really Need?
    How to Build a Server Room Temperature and Humidity Monitoring System?
    LoRa vs LoRaWAN Environmental Monitoring: Sensors, Gateways, Range, Battery Life and Interoperability
    menu-header-svg
    Search
    • Explore Knowledge
      • Comparison & Selection
      • Industry Solution
      • Product & Device
      • Criterion & Compliance
      • Deployment & Usage
      • Technology & Principle
    • Academic Research
    • In-depth Tech

    Technology & Principle

    See More >>

    What Environmental Parameters Matter Beyond ISO Class in a Cleanroom?

    Published: September 23, 2026

    Updated: September 23, 2026

    By Frank Hill

    An ISO cleanroom class tells you how many airborne particles are permitted at defined particle sizes. It does not, by itself, tell you whether temperature is stable, relative humidity is suitable for the process, pressure cascades are intact, airflow is behaving as intended, or the monitoring system can reconstruct an excursion after a network failure. ISO 14644-1 classifies air cleanliness by airborne particle concentration; other physical or chemical attributes have to be specified and controlled according to the process, facility design, product risk, and applicable industry requirements.

    For a quality engineer or cleanroom manager, the practical question is therefore broader: what environmental parameters should be monitored in a cleanroom, how should those parameters be measured, and which ones need continuous alarms rather than periodic qualification tests? This article separates classification from operational monitoring, explains the measurement chain, and compares several monitoring architectures used for distributed cleanroom points.

    What Environmental Parameters Should Be Monitored in a Cleanroom? 30-Second Answer

    Cleanroom environmental monitoring parameters beyond ISO class, including temperature, humidity, differential pressure, airflow, and airborne particles.what environmental parameters should be monitored in a cleanroom

    Beyond ISO class, a cleanroom should also monitor temperature, humidity, differential pressure, airflow, and process-relevant contaminants.

    User question Core conclusion
    Does ISO class cover all cleanroom conditions? No. ISO 14644-1 classifies airborne particle concentration. Temperature, humidity, pressure, airflow, chemical contamination, microbiological conditions and other attributes depend on the process and risk.
    Which parameters are commonly monitored continuously? Temperature, relative humidity and differential pressure are common facility parameters. Particle counts may also be continuous where process risk or regulation requires it.
    Is airflow velocity always a continuous sensor point? Not necessarily. Airflow velocity and visualization are often qualification or periodic verification tests; continuous airflow or fan status may be added when the process risk justifies it.
    Do all cleanrooms need microbial monitoring? No. Microbial environmental monitoring is application-specific, especially relevant to sterile or biocontamination-sensitive operations rather than every ISO-classified room.
    What matters beyond sensor accuracy? Range, uncertainty, drift, response time, calibration, placement, logging interval, local storage, alarm delay, time synchronization and data integrity all affect the usable result.
    What architecture works for distributed points? Wired analog/RS485, proprietary wireless, or mixed architectures can all work. Selection depends on cable access, point count, validation needs, network policy and integration requirements.

    Selection takeaway:

    define the process risks first, then assign each parameter a measurement location, sensor technology, alarm strategy, calibration method and data-retention requirement.

    Why ISO Class Alone Is Not Enough

    ISO 14644-1:2015 is deliberately narrow: it classifies cleanrooms and clean zones by airborne particle concentration, using light-scattering airborne particle counters at designated sampling locations. It does not characterize the viable, chemical or other nature of particles, and it does not prescribe universal temperature, humidity or room-pressure setpoints.

    ISO 14644-2:2015 then addresses a monitoring plan for demonstrating performance related to air cleanliness by particle concentration. ISO 14644-3:2019 provides test methods for cleanroom performance, while ISO 14644-4:2022 covers design, construction and start-up requirements. Together, these standards make an important distinction: classification is one controlled attribute, not a complete environmental-control specification.

    Application-specific rules can go further. EU GMP Annex 1 for sterile medicinal products, for example, distinguishes cleanroom qualification from operational environmental monitoring and identifies tests such as airflow measurement, air-pressure difference, airflow direction, microbial contamination, temperature, relative humidity, recovery and containment leak testing where relevant. FDA inspection guidance for sterile drug operations similarly expects pressure differentials, temperature and humidity to be monitored and excursions to be investigated. Those pharmaceutical expectations should not be copied into an electronics or precision-assembly cleanroom without a process-based rationale; they are examples of how industry risk changes the monitoring plan.

    What Does the Complete Cleanroom Monitoring Data Path Look Like?

    A useful monitoring architecture starts at the physical environment and ends with a record that can be reviewed after an event. The typical path is:

    Cleanroom condition -> sensor/transmitter -> signal conversion -> edge logger or gateway -> local memory -> facility network -> cloud or on-premises platform -> alarms, trends, reports and integration

    The sensor converts a physical condition into a measurable signal. A differential-pressure transmitter may output 4-20 mA or Modbus; a temperature/humidity probe may provide a digital RS485 signal; a particle counter may use Ethernet or a vendor protocol. The edge logger time-stamps the reading, applies configuration such as scaling or engineering units, and should retain data locally when the network is unavailable. The platform then provides trend views, alarms, user access, audit records, exports and integration into BMS, MES, LIMS or other quality systems.

    This separation matters because a network interruption should not automatically become a measurement gap. Local continuity, accurate clocks and controlled backfill are part of the measurement system, not merely IT conveniences.

    Cleanroom monitoring data path from sensors and edge loggers through local memory and networks to cloud or on-premises platforms, alarms, reports, and APIs.

    Cleanroom monitoring is a complete data path from field sensors to local storage, network transport, and the monitoring platform.

    How the Core Measurements Work

    Temperature and relative humidity

    Temperature and relative humidity influence operator comfort, product behavior, static charge, moisture absorption, condensation risk and the stability of some processes. Electronic humidity probes commonly use capacitive sensing elements whose electrical capacitance changes with absorbed water vapor. Temperature is typically measured by an RTD, thermistor or semiconductor element. In a combined transmitter, the electronics convert these signals to calibrated engineering values and may transmit them digitally or through analog outputs.

    There is no universal cleanroom temperature or RH requirement in ISO 14644-1. The setpoint and alarm band must come from the process, product, gowning load, equipment heat, condensation/static risk and any sector-specific standard. A tighter display resolution does not automatically mean better accuracy, and a sensor specified at room conditions may not have the same uncertainty across the full operating range.

    Differential pressure

    Differential pressure is a proxy for the pressure cascade between rooms or zones. A differential-pressure sensor compares pressure at two ports and converts the small pressure difference to an electrical signal. The important engineering question is not only the sensor range, but whether the tubing, reference point, installation height, door operation and HVAC control strategy allow the reading to represent the intended pressure barrier.

    Pressure alarms usually need a delay or hysteresis because doors create short transients. A delay should filter expected events without masking a sustained loss of containment or protection. In sterile or high-risk operations, pressure trends and alarm history can be as important as the live display because they show whether the required cascade was maintained throughout production.

    Cleanroom differential-pressure cascade between higher- and lower-cleanliness rooms, showing pressure references, door transients, and alarm delay.

    Effective differential-pressure monitoring depends not only on sensor accuracy, but also on the reference point, door status, and alarm delay.

    Airflow, air-change performance and room recovery

    Airflow velocity, volume and direction explain how filtered air removes or displaces contamination. These attributes are often verified during qualification using calibrated anemometers, balometers and visualization methods. They are not always represented by one permanently installed sensor. Continuous monitoring may instead use fan status, duct pressure, airflow transmitters or BMS points when a loss of airflow creates a meaningful process risk.

    This distinction prevents over-instrumentation. A parameter can be critical to cleanroom performance without needing a permanent sensor at every location. Qualification tests establish performance; operational monitoring watches the parameters whose drift can indicate loss of control between qualification events.

    Airborne particles and process-specific contamination

    Airborne particle concentration is the basis of ISO classification and may also be monitored operationally in critical processes. The sampling strategy, particle sizes, locations and alert levels should reflect the room classification and process risk. Chemical contamination is separate: ISO 14644-8:2022 provides a framework for assessing air cleanliness by chemical concentration where airborne molecular contamination threatens the product or process. Semiconductor, optics and battery manufacturing may care about acids, bases, organics or specific gases that would be irrelevant in another cleanroom.

    Microbiological monitoring is also process-specific. Sterile pharmaceutical operations may require viable airborne and surface monitoring, while many industrial cleanrooms do not. The monitoring plan should therefore be built from contamination mechanisms, not from an assumption that every cleanroom needs every sensor type.

    Which Monitoring Architectures Are Commonly Used?

    Comparison of analog, RS485, Ethernet, wireless gateway, and mixed edge architectures for cleanroom environmental monitoring.

    Analog wiring, RS485, Ethernet, proprietary wireless, and mixed edge architectures each have distinct application boundaries.

    Architecture How it works Strengths Limits Typical fit
    Wired analog (4-20 mA / voltage) Transmitters feed analog input modules or PLC/BMS I/O. Mature, deterministic, easy to integrate with existing controls. More cabling; scaling and loop power must be managed. Fixed facilities with many existing industrial transmitters.
    RS485 / Modbus RTU Multiple digital transmitters share a serial bus using addresses. Multi-drop wiring, digital values, broad industrial sensor choice. Bus topology, termination, addressing and power need engineering. Distributed T/RH, pressure and multi-parameter points.
    Ethernet / Modbus TCP IP-connected devices or converters send data over LAN. Fits enterprise networks; direct BMS/SCADA integration. IT approval, switch capacity, cybersecurity and PoE design matter. Permanent cleanrooms with structured network infrastructure.
    Proprietary sub-GHz / LoRaWAN Wireless sensors transmit to dedicated gateways. Long range, less field wiring, flexible expansion. Requires RF planning, gateways and vendor ecosystem management. Retrofits, large campuses and difficult cable routes.
    Mixed edge architecture A local host combines RS485/analog/wireless inputs and forwards normalized data. Can consolidate heterogeneous sensors and provide local display/storage. Edge device becomes a critical design point; protocol compatibility must be verified. Sites needing flexible third-party integration and phased expansion.

    Which Technical Parameters Affect Real-World Monitoring?

    Measurement range comes first: the selected transmitter must cover normal operation and credible excursions without sacrificing useful resolution. Accuracy should be read together with its stated conditions, calibration uncertainty and long-term drift. Resolution only describes the smallest displayed or stored increment; it does not prove the measurement is correct to that increment.

    Response time affects alarms. A fast pressure sensor may reveal every door opening, while a slow sensor or long averaging window may hide a developing HVAC fault. Sampling and logging intervals determine the time resolution of the historical record. Alarm delays and hysteresis should be justified by process behavior rather than chosen only to reduce nuisance alarms.

    For networked systems, local storage capacity, backup power, clock synchronization, backfill behavior and communication-loss alarms determine whether data remains reconstructable. For regulated records, user roles, configuration history, audit trail scope, report generation and backup/restore controls become part of the system design. Calibration also needs a lifecycle: the probe or transmitter should be replaceable or removable without creating unnecessary downtime, and calibration points should cover the actual operating range.

    How Should Nearby Technologies Be Chosen?

    Parameter Typical technology Use when Key caution
    Temperature / RH Calibrated T/RH probe or transmitter Process-specific setpoint and alarm band Humidity location must avoid direct supply-air bias or condensation-prone mounting.
    Differential pressure Low-range differential-pressure transmitter Room-to-room or room-to-corridor cascade Tubing/reference placement and door transients can dominate the reading.
    Airflow Qualification instruments or permanent airflow/duct sensors Where airflow loss directly threatens process control Do not assume qualification airflow tests require permanent sensors everywhere.
    Airborne particles Light-scattering particle counter ISO classification and risk-based operational monitoring Sampling location, flow rate and tubing losses affect results.
    Chemical / gas contamination Process-specific gas or AMC sensor/analyzer Only where chemical contamination is a defined risk Select by target compound, detection limit, cross-sensitivity and response time.
    Door state / equipment status Dry contact, magnetic contact, BMS status point Correlating excursions with access or HVAC events Context signal, not a substitute for environmental measurement.

    Representative Cleanroom Monitoring Architectures Compared

    The systems below are not identical product forms. They are compared as complete monitoring architectures because cleanroom projects usually combine sensors, edge hardware, networking and software. Specifications are based on official manufacturer documentation reviewed in September 2026; where a public source did not define a universal limit, the table says so rather than estimating it.

    Enterprise cleanroom monitoring architecture comparison across UbiBot, Vaisala, Rotronic, Dickson, and Monnit approaches.

    Enterprise cleanroom monitoring systems mainly differ in edge architecture, third-party sensor integration, local data continuity, and platform integration.

    System Edge architecture Sensor / network interfaces Local continuity / display Software / integration Typical fit
    UbiBot GS1-AETH1RS / GS1A-AL4G1RS + RS485 sensors + On-Premises GS1 edge host with built-in T/RH and RS485 external-sensor interface; 4-inch LCD. Public documentation does not state one universal maximum number of third-party RS485 nodes. RS485 Universal Sensor Converter supports compatible third-party RS485 query/response protocols; Ethernet model supports Wi-Fi + Ethernet/PoE option; 4G model supports Wi-Fi + cellular. 300,000 sensing records on GS1. Local display of configured channels. On-Premises platform can run without Internet. Public cloud or on-premises; HTTP/MQTT APIs, data forwarding, MySQL/API/script integration on OPP. Field-change audit-trail information is documented by UbiBot. Flexible mixed-sensor deployments where RS485 openness, local display, network choice and API integration matter. Verify external sensor calibration and protocol compatibility for each cleanroom point.
    Vaisala viewLinc ES 5.2 + CAB100 + DL4000 CAB100 industrial cabinet aggregates differential-pressure and analog channels; large CAB100B analog configuration supports up to 32 analog input channels. DL4000 supports up to four analog inputs per logger. Analog voltage/current inputs; Ethernet, Wi-Fi or vNet/PoE options depending configuration. Third-party analog transmitters can be integrated through CAB100/DL4000. DL4000 records at the measurement point with battery-backed autonomous memory; reviewed CAB100/DL4000 documents do not describe one built-in operator display for all channels. viewLinc Enterprise Server 5.2 is customer-hosted; alarms, reports, Active Directory support and OPC UA integration are available. Strong fit for regulated or enterprise environments needing mature validation, calibration and centralized monitoring workflows.
    Rotronic RMS On-Premise + RMS-ADC-L-R + RMS-CONVERTER-100 RMS-ADC-L-R provides two analog sensor inputs and stores 44,000 pairs of measured values. RMS-CONVERTER-100 integrates up to 100 measuring points. Analog 0/1/5/10 V and 0/4-20 mA through ADC logger; Modbus TCP and selected digital protocols through converter; third-party integration also possible through API. ADC logger has local memory; RMS-CONVERTER-100 provides 7 days of data logging. Optional RMS Display can show selected points. RMS software can run on customer SQL infrastructure; audit trail, reports, API, OPC UA options and GxP-oriented validation tooling are available. Useful where analog and Modbus TCP instrumentation must be integrated into a validated on-prem monitoring environment.
    Dickson OCEAView On-Premises + Cobalt X Cobalt X1 supports 2 simultaneous channels; X2 supports 4 simultaneous channels and up to four wireless sensors assigned. 2.4-inch touchscreen. Primarily Dickson Smart-Sensors plus Bluetooth/LoRaWAN. Connect Gateway provides Ethernet, Wi-Fi or 4G backhaul. Public docs reviewed emphasize Dickson sensor ecosystem rather than generic third-party sensors. Onboard memory; current Dickson comparison material lists 16,000 readings for Cobalt X. Local touchscreen supports alarm acknowledgement. OCEAView Cloud or On-Premises; long-range LoRaWAN gateway architecture, alarm workflows and calibration-aware Smart-Sensors. Good fit for life-science sites that value local touchscreen operation, replaceable calibrated sensors and LoRaWAN coverage.
    Monnit iMonnit Enterprise + ALTA EGW4 + ALTA sensors EGW4 supports up to 100 ALTA wireless sensors; iMonnit Enterprise licensing is offered by sensor count. Proprietary ALTA wireless network to Ethernet gateway. Modbus TCP and SNMP can expose sensor data to third-party systems; gateway unlock is required for some private-interface use cases. Current EGW4 firmware can retain up to 50,000 sensor messages during server/network outages and upload them later. Gateway itself has status LEDs rather than full measurement display. iMonnit Enterprise is installed on customer servers and supports alerts and CSV export; Monnit also documents REST API/webhook capabilities in its software ecosystem. Scalable wireless retrofit architecture where long-range battery sensors and simple Ethernet gateway deployment are priorities.

    The comparison shows different design philosophies rather than a single winner. Vaisala and Rotronic provide mature life-science monitoring ecosystems with strong validation and calibration tooling. Dickson emphasizes local touchscreen operation, replaceable Smart-Sensors and LoRaWAN-based monitoring. Monnit is especially scalable for proprietary long-range wireless sensor networks. UbiBot’s differentiator is architectural flexibility: GS1 can combine a local display, 300,000-record memory, Ethernet or cellular backhaul depending model, RS485 third-party sensor integration, APIs and an optional on-premises platform. That flexibility is useful when a cleanroom project needs to consolidate temperature, humidity, differential pressure or other Modbus points without forcing every measurement onto one proprietary sensor family.

    The trade-off is that an open architecture transfers more responsibility to the project team. Sensor accuracy, calibration, protocol mapping, power, bus design, alarm logic and validation evidence must be specified for the complete measurement channel. On-premises deployment also provides data-location control but does not automatically establish GxP or Part 11 compliance; the intended workflow still has to be assessed and validated where required.

    How Should Monitoring Differ by Cleanroom Application?

    Electronics and precision assembly cleanrooms

    Airborne particles remain central, but temperature and RH may be equally important to dimensional stability, static control, soldering, coating or optical processes. Chemical contamination may become critical for semiconductor or optics manufacturing. The monitoring plan should follow the process sensitivity, not a pharmaceutical template.

    Sterile pharmaceutical or aseptic areas

    Pressure cascades, temperature, humidity and non-viable particle monitoring are typically integrated with the facility monitoring strategy, while viable monitoring is addressed through the contamination-control program. EU GMP Annex 1 is a key application-specific reference. Alarm history, user roles, time synchronization, audit trails and investigation workflows become especially important because the data can support batch and deviation decisions.

    Medical-device and controlled assembly areas

    The required parameters depend on the product and contamination risks. Some operations need particle classification plus T/RH and pressure; others may require fewer continuous points but stronger periodic qualification. A risk assessment should define which environmental changes can affect product quality before sensors are selected.

    Laboratory clean zones and controlled rooms

    Small controlled rooms often benefit from a mixed architecture: one local edge host can collect T/RH and pressure while a particle counter remains on its own qualified schedule. This avoids overloading the system with unrelated instruments while still creating one operational alarm and trend view for facility conditions.

    Common Deployment Mistakes

    Using ISO class as a complete environmental specification

    ISO class defines particle concentration, not universal T/RH, pressure or microbial limits. The project URS should explicitly define each additional controlled parameter and why it matters.

    Selecting sensors before defining the measurement point

    A highly accurate sensor in a poor location still produces a poor process representation. Pressure reference points, probe height, supply-air influence, heat sources, door paths and operator zones should be defined before mounting hardware.

    Treating display resolution as accuracy

    A 0.01 display increment does not prove ±0.01 measurement performance. Procurement should compare stated accuracy or uncertainty under the intended range, calibration evidence, drift and recalibration method.

    Ignoring network and power failure behavior

    A platform can only reconstruct an excursion if measurements continue during the outage. Verify local memory, gateway buffering, backup power, time synchronization and the exact backfill sequence during commissioning.

    Applying the same alarm delay to every parameter

    Door-related pressure transients, slowly drifting humidity and particle excursions have different time behavior. Alarm delay and hysteresis should be parameter-specific and justified against process risk.

    Assuming on-premises equals compliant

    Local hosting answers a data-location and infrastructure-control question. Regulated use also requires access control, audit-trail scope, backup/restore, configuration control, validation, procedures and trained users.

    Cleanroom monitoring deployment pitfalls involving sensor placement, calibration range, offline data continuity, and alarm delay logic.

    Sensor placement, calibration, offline continuity, and alarm logic together determine whether monitoring data can be trusted.

    Frequently Asked Questions

    What environmental parameters should be monitored in a cleanroom?

    At minimum, monitor the parameters that can affect product quality or contamination control. Common operational points include temperature, relative humidity and differential pressure. Airborne particles may be monitored continuously or periodically depending on the room and process. Airflow, microbial contamination, chemical contamination, door status and equipment state are added when the risk assessment or sector rules require them.

    Does ISO 14644 specify cleanroom temperature and humidity limits?

    ISO 14644-1 does not prescribe universal temperature or relative-humidity setpoints. It classifies air cleanliness by airborne particle concentration. T/RH limits should come from the product, process, equipment, operator requirements, contamination-control strategy and any applicable sector-specific standards.

    Should differential pressure be monitored continuously?

    Often yes when the room-to-room pressure cascade is a critical contamination-control barrier. Continuous trending and alarms can reveal sustained HVAC or door-related problems that a periodic reading would miss. The required alarm limit and delay should be defined from the facility design and process risk.

    Do all cleanrooms need continuous particle counters?

    No. ISO classification requires particle measurement, but continuous operational particle monitoring depends on the cleanroom grade, process risk and applicable regulation. Critical sterile zones commonly have more intensive particle monitoring than many industrial cleanrooms.

    Can one monitoring platform combine temperature, humidity and pressure sensors?

    Yes, if the platform and edge hardware support the required interfaces. Mixed systems may combine RS485/Modbus, 4-20 mA, voltage, Ethernet or proprietary wireless sensors. The key is to validate channel identity, scaling, calibration, time stamps and alarm behavior for each measurement point.

    What happens if the cleanroom monitoring network goes offline?

    A robust architecture continues to log measurements locally and uploads the missing data after connectivity returns. The exact behavior depends on the device and gateway. Commissioning should test network loss, power loss, buffer capacity, time synchronization, backfill and offline alarms.

    How often should cleanroom sensors be calibrated?

    There is no single universal interval. The calibration frequency should reflect sensor stability, manufacturer guidance, historical drift, process risk, regulatory expectations and the facility calibration program. The calibration range and points should cover the actual operating conditions.

    Conclusion

    What environmental parameters matter beyond ISO class in a cleanroom? The answer depends on what the cleanroom is protecting. ISO class describes airborne particle concentration, while operational control may also depend on temperature, humidity, pressure cascades, airflow behavior, chemical contamination, microbiological conditions and equipment status. Not every parameter needs a permanent sensor, but every critical parameter needs a defined measurement and verification strategy.

    For procurement, the sensor specification is only one layer. Location, calibration, local continuity, alarm design, data integrity and integration determine whether the system can support real decisions after an excursion. Enterprise platforms from Vaisala, Rotronic, Dickson and Monnit show different ways to solve this problem. UbiBot offers a flexible alternative based on GS1 edge hosts, RS485 sensor integration, local storage, multi-network connectivity, APIs and optional on-premises deployment. The correct architecture is the one that can represent the required cleanroom parameters with traceable measurements and recoverable records throughout the operating lifecycle.

    Source and Specification Note

    Standards and product specifications were reviewed in September 2026 from official standards bodies, regulatory agencies and manufacturer documentation. Product capabilities can change by hardware revision, region, firmware and software license. Where official public documentation did not state a universal capacity or feature, this article does not infer one. Application-specific limits should be confirmed in the project URS, current standard, current manufacturer datasheet and validation package before procurement or deployment.

    Official References

    [1] ISO 14644-1:2015 – Classification of air cleanliness by particle concentration. https://www.iso.org/standard/53394.html

    [2] ISO 14644-2:2015 – Monitoring to provide evidence of cleanroom performance. https://www.iso.org/standard/53393.html

    [3] ISO 14644-3:2019 – Test methods. https://www.iso.org/standard/60598.html

    [4] ISO 14644-4:2022 – Design, construction and start-up. https://www.iso.org/standard/72379.html

    [5] ISO 14644-8:2022 – Assessment of air cleanliness by chemical concentration. https://www.iso.org/standard/76890.html

    [6] EU GMP Annex 1 – Manufacture of Sterile Medicinal Products. https://health.ec.europa.eu/medicinal-products/eudralex/eudralex-volume-4_en

    [7] FDA – Sterile Drug Products Produced by Aseptic Processing. https://www.fda.gov/regulatory-information/search-fda-guidance-documents/sterile-drug-products-produced-aseptic-processing-current-good-manufacturing-practice

    [8] UbiBot GS1 specifications. https://www.ubibot.com/ubibot-gs1-specifications/

    [9] UbiBot On-Premises Platform. https://www.ubibot.com/on-premises-platform/

     

    分享

    LinkedIn2

    Facebook2

    X

    Newsletter Signup

    Related Resources

    How to Select Temperature Monitoring Devices for Pharmaceutical Storage and Transport Under USP <1079.3>
    What EN 12830 Means When Selecting a Cold-Chain Temperature Recorder?
    Water Leak Detection for Data Centers and Warehouses
    Commercial Indoor Air Quality Monitors for CO2 PM2.5 TVOC and BMS Integration
    How to Monitor Temperature, Humidity and Differential Pressure in Medical Laboratories
    How Many Sensors Does a Greenhouse Really Need?
    How to Build a Server Room Temperature and Humidity Monitoring System?
    LoRa vs LoRaWAN Environmental Monitoring: Sensors, Gateways, Range, Battery Life and Interoperability
    menu-header-svg
    Search
    • Explore Knowledge
      • Comparison & Selection
      • Industry Solution
      • Product & Device
      • Criterion & Compliance
      • Deployment & Usage
      • Technology & Principle
    • Academic Research
    • In-depth Tech
    Enter Your Information

    Confirm

    Products

    Dashboards

    Support

    Purchase

    Company

    Smart Sensing

    UbiBot Web Console

    APP Download

    UbiBot Online Store

    News

    Smart Control

    UbiBot Space

    Product Docs & APIs

    Find Distributors

    Learn Hub

    Smart Video

    UbiBot On-Premises

    Helpdesk & FAQ

    Volume Pricing

    About Us

    LoRa Products

    Agency Web Console

    Video Center

    Contact Us

    Software & Platform


    Pricing


    Architecture

    External Sensors


    System Status

    Accessories


    Become a Distributor

    Global SIM


    Become an Affiliate

    Positioning System


    Products

    Dashboards

    Business Partners

    WS1

    UbiBot Web Console

    Volume Pricing

    WS1 Pro

    UbiBot Space

    Become a Distributor

    GS1

    UbiBot Support Desk

    Affiliates

    GS2

    Agency Web Console


    MS1


    SP1


    Accessories


    Docs

    Purchase

    Company

    Platform API

    Pricing

    News

    Q&A

    UbiBot Partners

    About us

    Privacy Policy

    Online Store

    Contact

    Terms of Service


    System Status

    Products

    Dashboards

    Smart Sensing

    UbiBot Web Console

    Smart Control

    UbiBot Space

    Smart Video

    UbiBot On-Premises

    LoRa Products

    Agency Web Console

    Software & Platform


    External Sensors


    Accessories


    Global SIM


    Positioning System


    Support

    Purchase

    APP Download

    UbiBot Online Store

    Product Docs & APIs

    Find Distributors

    Helpdesk & FAQ

    Volume Pricing

    Video Center


    Pricing


    Company

    News

    Learn Hub

    About Us

    Contact Us

    Architecture

    System Status

    Become a Distributor

    Become an Affiliate

    Language:
    English 日本語 (ベータ)  
    Language:

    English

    日本語 (ベータ)


    IoT Product Family:
    ubibotico     Wireless environmental sensing products and smart building solutions
    ubitrackico     UWB-based real-time indoor tracking solutions with 30cm accuracy

    IoT Product Family:

    ubibotico  Wireless environmental sensing products and smart building solutions
    ubitrackico  UWB-based real-time indoor tracking solutions with 30cm accuracy

    © 2013-2026 UbiBot.com. All rights reserved.

    Terms of Service | Privacy Policy | Compliance

    youtube facebook twitter