
UBiBot Logo
UBiBot Logo
  • UBiBot Logo
  • Home
  • Products

    NEW

  • Pricing
  • Support
  • About Us
  • Download
  • magnifying-glass  Search
  • magnifying-glass header-close
  • Sign in Sign in
    Public Web Console Public Web Console
    On-Premises App Center On-Premises App Center
  • Home
  • Products

    NEW

  • Pricing
  • Support
  • About us
  • Download
  •  Public Web Console
  •  On-Premises App Center
  • Where to Buy

Learn Hub

Explore Knowledge Academic Research In-depth Tech

Share

LinkedIn

Facebook

X (Twitter)

Newsletter Signup

Table of contents

    What Is an Environmental Monitoring System and How Does It Work?

    Introduction

    An environmental monitoring system turns changing physical conditions into records that people can review, act on, and integrate with operations. For a facility manager, that may mean tracking temperature and humidity across storage rooms. For a laboratory, it may include refrigerators, CO2, pressure, and alarm history. For a smart building, the same idea can extend to particulate matter, volatile organic compounds, light, and ventilation-related indicators. The common mistake is to think the system is just a sensor. In practice, reliable monitoring depends on an end-to-end chain: sensing, signal conversion, data logging, connectivity, local retention, software, alarms, reporting, and maintenance. This article explains how that chain works, how common architectures differ, and how to select a system for a real site rather than from a feature list alone.
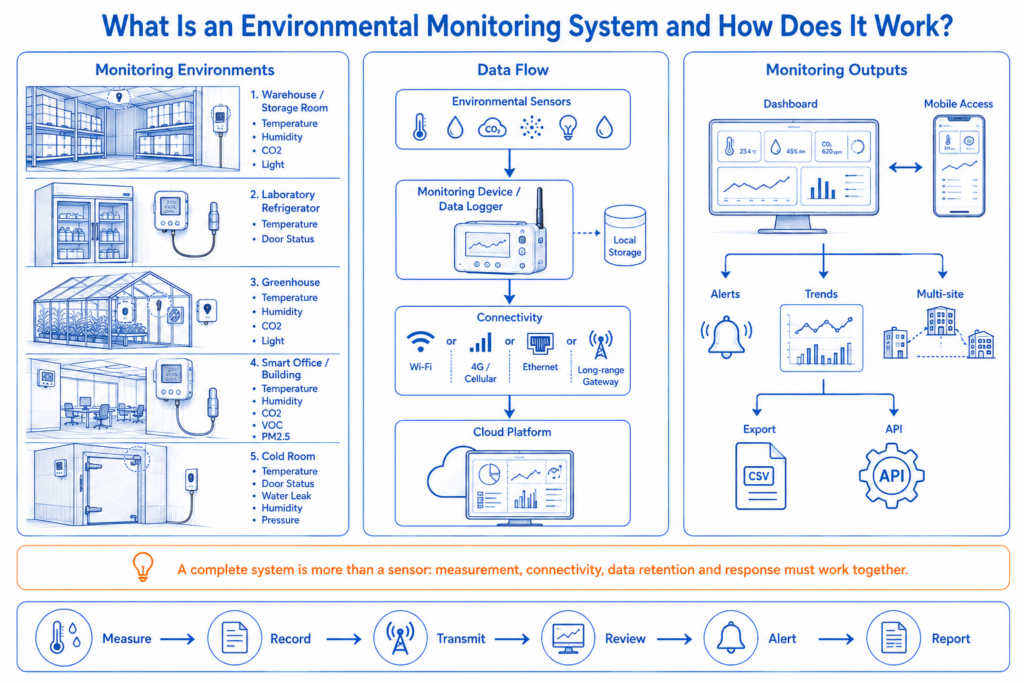
    Environmental monitoring system overview showing sensors, data loggers, connectivity, cloud dashboards, alerts and reports across real-world sites.

    Environmental monitoring system overview showing sensors, data loggers, connectivity, cloud dashboards, alerts and reports across real-world sites.

    30-Second Summary

    Question Core answer
    What is it? A connected system that measures environmental conditions, records them over time, and turns exceptions into visible alarms, reports, or actions.
    What does it usually measure? Temperature and humidity are common; CO2, PM2.5, TVOC, pressure, light, leaks, door status, and external probe data may be added when the application requires them.
    What are the main layers? Sensors -> device or data logger -> connectivity -> local/cloud platform -> alarms, reports, APIs, and operational response.
    Does every site need a gateway? No. Wi-Fi, Ethernet, or cellular devices can connect directly. Long-range radio and some proprietary wireless architectures usually use a gateway or access point.
    What protects data during an outage? On-device memory, buffering, battery backup, time synchronization, and verified backfill behavior are more important than a dashboard that is merely online.
    What should buyers compare first? Measurement requirements, point count, network conditions, local data retention, alarm workflow, calibration, integration, and lifecycle cost – not a single accuracy number.


    One-sentence selection rule:

    Choose the system architecture from the measurement risk, number of points, network conditions, local data-retention needs, alarm workflow, calibration plan and integration requirements – not from one headline specification.


    1. Why Do You Need an Environmental Monitoring System?

    The immediate reason for environmental monitoring is simple: manual spot checks cannot describe what happened between inspections. A room can drift out of range for an hour and recover before the next walkthrough. A refrigerator can cycle abnormally overnight. A greenhouse zone can overheat while another remains stable. A server room can develop a local hot spot even when the wall thermostat looks normal. Continuous or scheduled logging creates a time series that makes these events visible.

    The technology also reduces fragmented records. Instead of temperature on one handheld meter, humidity on another, and air-quality data in a separate app, a monitoring platform can combine multiple parameters and locations into one operational view. That does not mean every project should monitor everything. Each parameter should answer a defined risk or operating question.

    The term also needs a boundary. In this article, an environmental monitoring system means a sensing and data system for physical conditions in facilities, storage areas, laboratories, buildings, agriculture, and similar operational environments. It is not the same as an environmental management system under ISO 14001. ISO 14001:2026 is a management-system standard for organizational environmental performance; it is broader than room or asset monitoring. [6]

    2. What Makes Up the Complete System and Data Path?

    A complete environmental monitoring system is best understood as a data chain rather than a single device. The chain usually contains five functional layers.

    The sensing layer converts a physical condition into an electrical or digital measurement. Temperature may come from a thermistor, RTD, or digital sensor; CO2 may come from an NDIR sensor; particulate matter is commonly estimated optically. The important point is that the sensor has a defined range, accuracy specification, response behavior, and environmental limits.

    The device or edge layer reads those sensors, time-stamps the data, applies calibration or compensation settings where supported, stores records locally, and decides when to transmit. A data logger may also accept external probes, RS485 instruments, dry contacts, or analog inputs. This layer is where sampling interval, battery behavior, local memory, and device health become practical design issues.

    The connectivity layer carries data beyond the device. Wi-Fi is convenient where managed local networks are reliable. Ethernet is useful for fixed infrastructure and can reduce radio uncertainty. Cellular is useful for remote or mobile sites and can provide an independent route. Long-range radio architectures can reduce wiring across large facilities but normally add a gateway or access-point dependency. RS485 is different: it is a local wired bus used to connect sensors or instruments to a logger, controller, or gateway; it is not an Internet connection by itself.

    The platform layer stores and organizes the data. A cloud or on-premises platform may provide dashboards, device grouping, historical charts, user permissions, alarm rules, exports, and system status. Finally, the response and integration layer connects the measurements to people and other systems through notifications, scheduled reports, REST APIs, MQTT or HTTP interfaces, data forwarding, relays, or workflow tools. A technically complete design therefore follows the path: measurement -> record -> transmission -> retention -> interpretation -> response.
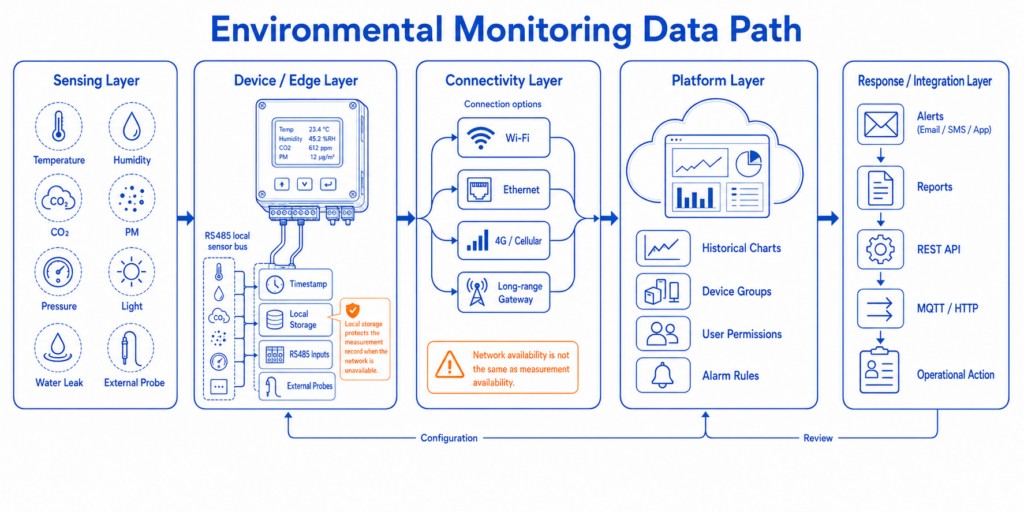
    Environmental monitoring data path from sensing and local logging through connectivity to cloud storage, alerts, reports and integrations.

    Environmental monitoring data path from sensing and local logging through connectivity to cloud storage, alerts, reports and integrations.

    3. How Does an Environmental Monitoring System Work?

    The core technology is a repeating measurement-and-decision cycle. First, a sensor samples the environment. The device converts the raw signal into an engineering value such as degrees Celsius, percent relative humidity, parts per million, micrograms per cubic meter, or lux. The device then assigns a timestamp and stores the record. Sampling can occur much more frequently than cloud upload; separating those two intervals can preserve useful detail without forcing the radio to remain active continuously.

    Next, the device decides how to move the data. A direct-connect Wi-Fi or cellular logger can send records straight to a remote platform. A long-range node may send them to a local gateway, which forwards them over Ethernet, Wi-Fi, or cellular backhaul. A wired RS485 sensor may feed a local logger that performs the Internet-facing work. The communication method changes the infrastructure, but the application requirement stays the same: records must arrive with enough context to show what was measured, where, when, and by which device.

    Local storage is a key reliability mechanism. Network availability and measurement availability are not the same thing. A well-designed logger should continue recording when the network fails and provide a defined method for later synchronization or manual export. UbiBot, for example, publishes 300,000-record onboard memory for WS1 Pro, AQS1, and GS1 models, and its support documentation describes continued local collection during Wi-Fi outages with later synchronization or offline export. [1][2][3][5] Other systems use different retention models; Vaisala RFL100 specifies 30 days or 43,200 samples per channel at its fixed one-minute sampling rate. [6]

    The platform then evaluates rules against the incoming stream. A threshold alarm is the simplest example, but effective monitoring also needs device-health awareness: communication loss, low battery, probe failure, stale data, and power loss can be as important as a high-temperature event. Alarm latency is determined by more than the sensor response time. It includes the sampling interval, upload interval, network path, server processing, notification channel, and human escalation process. Calling a system ‘real time’ does not remove these delays; buyers should verify the actual end-to-end behavior they require.

    4. What Are the Main Technology Routes?

    Most environmental monitoring projects fall into four architecture families. None is universally superior.

    Direct-connect wireless systems use Wi-Fi or cellular at the monitoring device. They are attractive for small and medium sites because each logger can reach the platform without a proprietary gateway. The trade-off is that every endpoint depends on suitable local Wi-Fi or cellular coverage and must manage its own radio power budget.

    Gateway-based wireless systems use a local radio link between endpoint loggers and an access point or gateway. This can provide long range, better penetration, or lower endpoint power. Vaisala RFL100, for example, uses VaiNet through an AP10 access point; an AP10 supports up to 32 RFL100 loggers, with a typical indoor range of at least 100 m. [6][7] The architectural trade-off is a shared infrastructure component that must be sized, powered, and monitored.

    Wired industrial systems use Ethernet, RS485/Modbus, analog inputs, or combinations of these. They fit fixed plants, equipment rooms, and sites where deterministic cabling is easier to maintain than radio. Wiring increases installation work, but it can simplify power and reduce wireless coverage problems.

    Multi-parameter indoor-air systems integrate several sensors in one enclosure. UbiBot AQS1, for example, combines temperature, humidity, atmospheric pressure, TVOC, eCO2, PM1.0/PM2.5/PM10, and CO2 channels, with Wi-Fi or 4G versions. [2] This is useful when the application needs an environmental profile rather than temperature alone, but integrated sensors should still be evaluated channel by channel because each measurement principle has its own range, accuracy, drift, and maintenance needs.
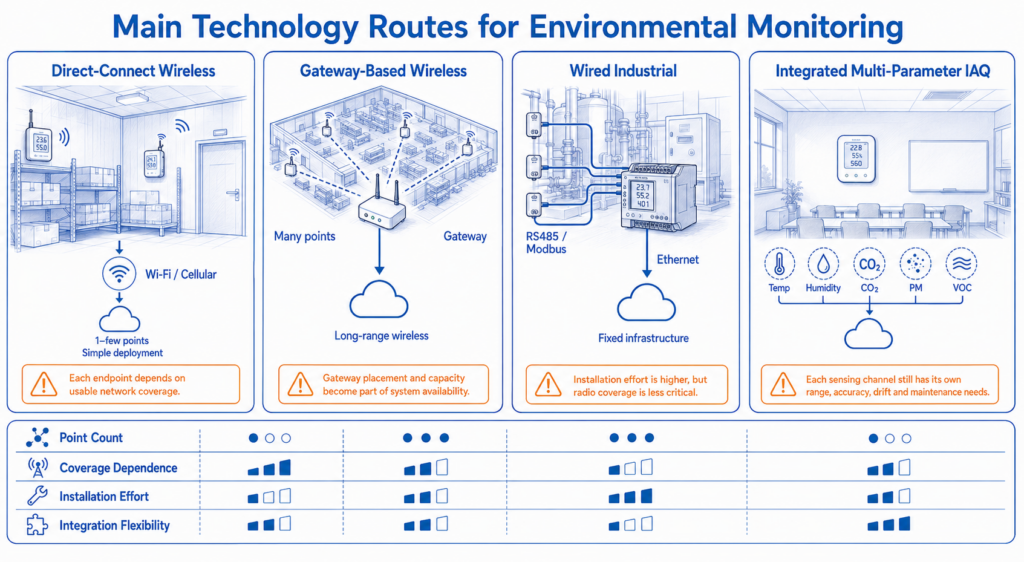
    Comparison of direct Wi-Fi or cellular, gateway-based wireless, wired industrial and multi-parameter environmental monitoring architectures.

    Comparison of direct Wi-Fi or cellular, gateway-based wireless, wired industrial and multi-parameter environmental monitoring architectures.

    5. Which Technical Parameters Affect Real-World Performance?

    Parameter What it means Why it matters in a project
    Measurement range The interval over which the sensor is specified. A probe that survives a freezer or process point may be different from the device’s own ambient operating range.
    Accuracy / uncertainty How close a measurement is expected to be under stated conditions. Compare the specified test range and conditions, not only the headline number. Regulated work may also require traceable calibration.
    Resolution The smallest displayed or recorded increment. High resolution does not guarantee high accuracy; a device can show many decimals and still have a larger measurement error.
    Response time How quickly the sensing element follows a change. Fast air sensors may react to door openings; buffered or immersed probes may better represent product temperature but respond more slowly.
    Sampling interval How often the device measures. Shorter intervals capture brief events but increase data volume and may increase power use.
    Upload interval How often records are transmitted. It affects alarm latency, bandwidth, battery life, and how much data must be buffered during outages.
    Local storage Records retained on the device or gateway. This determines how long measurement history can survive a network outage before data are overwritten.
    Connectivity and coverage Wi-Fi, Ethernet, cellular, long-range radio, or wired bus behavior. Coverage must be tested in the actual building, including racks, walls, cold rooms, metal structures, and remote zones.
    Calibration and drift How measurement performance changes and how it is checked over time. A commissioning result is not a permanent guarantee. Calibration interval should reflect sensor type, risk, environment, and quality requirements.

    The most common specification mistake is to compare unlike numbers. Accuracy is not resolution; typical performance is not the same as a maximum permissible error; a sensor’s measurement range is not the same as the logger’s operating temperature; and a communication range measured in open space is not a guarantee inside a reinforced building. For a serious project, define the required conditions first, then check whether each published specification applies under those conditions.

    6. How Should Similar Technologies Be Selected?

    Deployment condition Usually consider Decision logic
    One to a few rooms with reliable Wi-Fi Direct Wi-Fi loggers Simple infrastructure and fast deployment; confirm enterprise Wi-Fi compatibility, local buffering, and alarm path.
    Remote site or weak local IT infrastructure Cellular direct-connect Independent backhaul can simplify deployment; verify regional bands, subscription/data costs, indoor signal, and local storage.
    Large distributed facility with many points Gateway-based long-range wireless Reduces endpoint network configuration; verify gateway capacity, coverage, redundancy, and backhaul.
    Fixed industrial equipment and third-party probes Ethernet / RS485 / Modbus architecture Useful for wired integration and existing controls; define addressing, termination, polling, isolation, and gateway behavior.
    Indoor air quality or occupant environment Integrated multi-parameter monitor Convenient for CO2/PM/VOC plus temperature and humidity; check maintenance and accuracy per channel.
    Regulated or audit-sensitive workflow Governed monitoring platform with calibration, roles, audit evidence, and validated processes Select the complete system and operating procedure, not the logger alone. FDA Part 11 or EU GMP Annex 11 may become relevant when applicable electronic records are used in regulated processes. [9][10]

    Choose the architecture from the failure modes you need to tolerate. A direct Wi-Fi device can be the least complex solution for a small warehouse, but it may be a poor choice inside a metal cold room with no stable Wi-Fi. A gateway network can be excellent for many distributed sensors, but the gateway becomes part of the availability design. Ethernet can be robust, but it is expensive to add after a facility is finished. Cellular can bypass local IT, but signal quality and recurring data costs matter.

    For mixed sites, a hybrid system is often more practical than forcing one network everywhere. A facility might use Ethernet for a fixed industrial logger, Wi-Fi for office and laboratory rooms, cellular for a remote building, and RS485 probes for specialized measurement points. The platform should make those differences manageable without hiding them.

    7. Representative Environmental Monitoring Systems Compared

    The systems below solve similar monitoring problems but use different architectures and sensor portfolios. This is a system-level comparison, not a ranking of measurement accuracy. Where the measurement range depends on an external probe, the table says so rather than inventing a single system-wide value. Official information was reviewed in August 2026.

    System Type Measurement scope Published measurement figure Connectivity Local storage Platform / API Best fit
    UbiBot WS1 Pro + UbiBot IoT Platform Direct-connect environmental data logger Built-in temperature, RH and light; selected external temperature, PT100, air temperature/RH, soil and wind probes Temperature ±0.2°C at 0 to 60°C; RH ±2% at 10 to 90%RH for built-in channels [1] 2.4 GHz Wi-Fi or 4G by model; selected external sensors / RS485 interface 300,000 sensing records [1] Web/app historical data, alerts, CSV/PDF export, data forwarding and Open API functions; plan-dependent features apply [4] Small/medium storage, labs, museums, refrigerators with external probes, distributed sites
    Vaisala RFL100 + AP10 + viewLinc Gateway-based wireless continuous monitoring Temperature, humidity and CO2 according to selected Vaisala probes Probe-dependent; see the selected probe datasheet VaiNet to AP10; AP10 up to 32 loggers; typical indoor range at least 100 m [6][7] 30 days / 43,200 samples per channel at 1-minute sampling [6] Central alarms and reports; optional Web/REST API license [8] Large multi-point life-science, laboratory and controlled-storage environments
    Dickson Cobalt X + DicksonOne / OCEAView Universal touchscreen data logger Up to 4 simultaneous wired/wireless channels; temperature, RH, pressure, CO2, current, dry contact and light options [9] Depends on selected replaceable sensor LoRaWAN and Bluetooth Low Energy [9] DicksonOne comparison documentation lists 16,000 readings for Cobalt X [10] Remote monitoring, phone/text/email alarms; DicksonOne REST API available for integrations [10] Life sciences, labs, hospitals, storage and manufacturing with modular sensor needs
    testo Saveris 1 + testo 150 TUC4 Modular enterprise environmental monitoring system External digital probes plus analog options; measured range and accuracy depend on selected probes TUC4 analog NTC channel: -40 to +150°C, ±0.3°C; digital channels depend on probe [12] WLAN, LAN/PoE or testo UltraRange by communication module [11][12] Minimum 16,000 readings per channel for testo 150 TUC4 [12] Alarm management, audit trail/ERES features, reporting; REST API for third-party data retrieval and alarm forwarding [11] Pharmaceutical, laboratory and other governed monitoring projects requiring modular enterprise controls

    Measurement specifications are configuration-dependent where external probes are used.
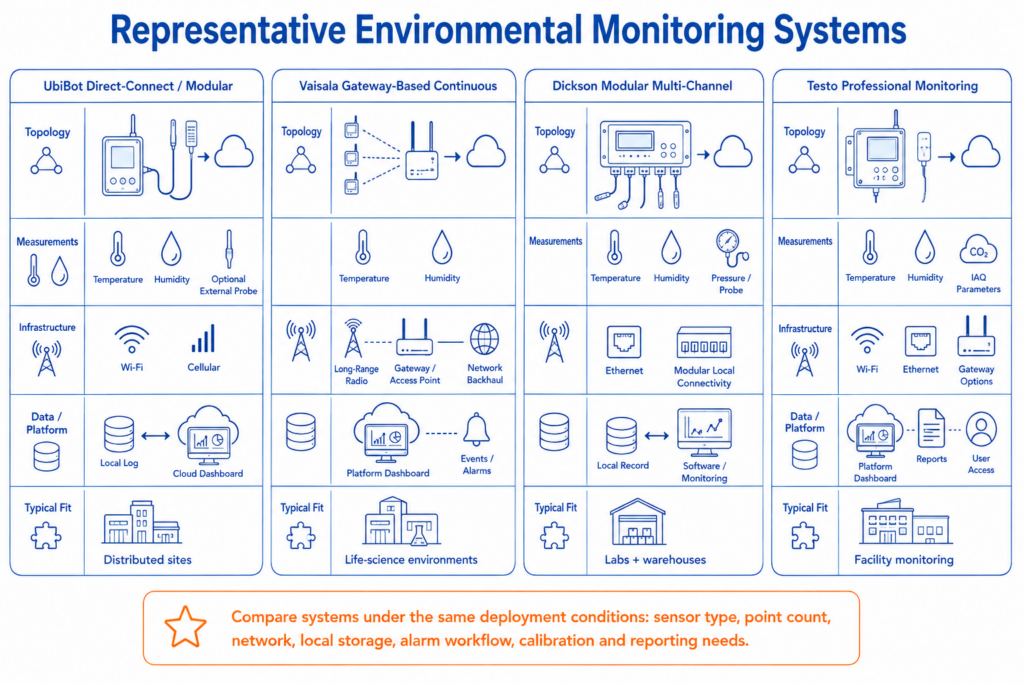
    Architecture-level comparison of representative environmental monitoring systems, showing direct-connect, gateway-based and modular monitoring approaches.

    Architecture-level comparison of representative environmental monitoring systems, showing direct-connect, gateway-based and modular monitoring approaches.

    The main differences are architectural. UbiBot’s WS1 Pro is a direct-connect option with substantial local record capacity and can be expanded with external probes; this can reduce gateway infrastructure for small and medium deployments. UbiBot AQS1 is a better fit when indoor-air parameters such as CO2, particulate matter, TVOC, and pressure are central, while GS1 variants extend the portfolio toward industrial environments and, depending on model, Wi-Fi, 4G, Ethernet, and RS485-connected sensing. [2][3]

    Vaisala’s RFL100 approach is purpose-built around a dedicated VaiNet access-point architecture and viewLinc governance. Dickson Cobalt X emphasizes a universal logger with replaceable sensor options and LoRaWAN/Bluetooth connectivity. Testo Saveris 1 is a modular enterprise system that combines data logger and communication modules with centralized software. These are different operating models, so selection should reflect site scale, validation or governance needs, network ownership, calibration service expectations, and total lifecycle cost rather than forcing an absolute winner.

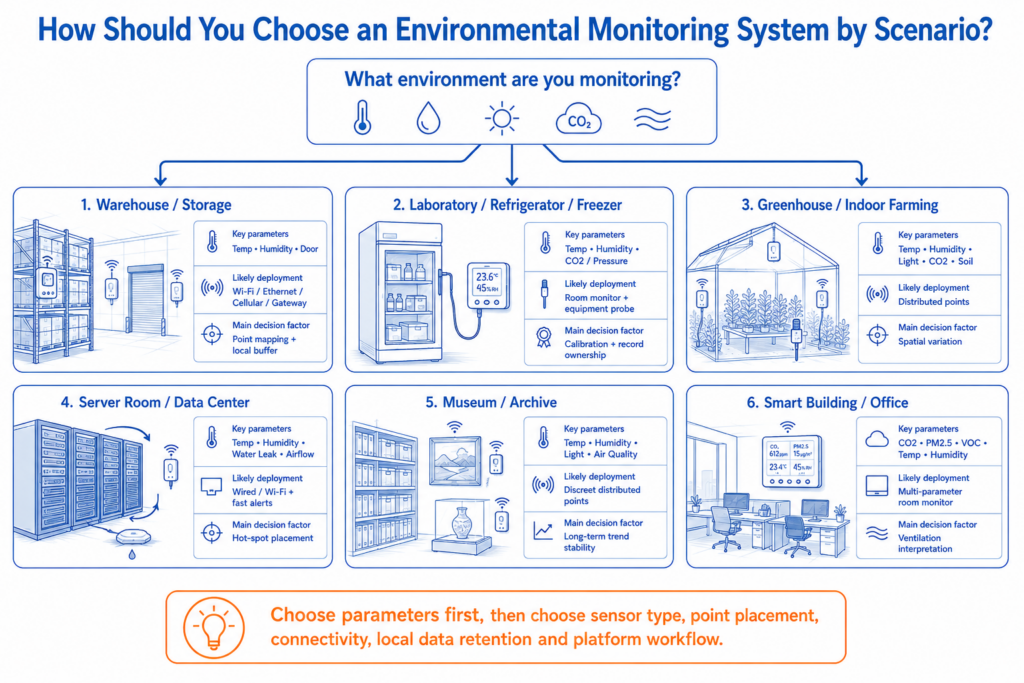
    8. How Should Different Application Scenarios Be Approached?

    Scenario Typical parameters Selection logic
    Warehouse / cold storage Temperature and humidity, door influence, external probe points Use mapping or risk assessment to locate representative points; favor local buffering and clear alarm escalation.
    Laboratory Temperature, humidity, CO2, pressure, refrigerators/freezers Separate room monitoring from equipment probes; define calibration and record ownership where data support quality decisions.
    Greenhouse / indoor farming Temperature, humidity, light, CO2, soil-related parameters Expect spatial variation; distributed wireless points and expandable probes are often more useful than one central monitor.
    Server room / data center Temperature, humidity, water leakage, airflow or equipment-state inputs Place sensors where thermal and leak risk exists, not only beside the thermostat; consider wired or Ethernet paths for fixed infrastructure.
    Museum / archive Temperature, humidity, light and sometimes air quality Prioritize stable trend data, low visual impact, placement away from direct HVAC flow, and long-term reporting.
    Smart building / office CO2, PM2.5, TVOC, temperature and humidity Use multi-parameter indoor-air monitors where ventilation and occupant environment matter; interpret each pollutant channel according to its sensing method.


    Scenario-based environmental monitoring selection guide for warehouses, laboratories, greenhouses, smart buildings, server rooms and cold storage.

    Scenario-based environmental monitoring selection guide for warehouses, laboratories, greenhouses, smart buildings, server rooms and cold storage.


    Regulated-use note:

    WHO storage guidance, the CDC Vaccine Storage and Handling Toolkit, FDA Part 11, and EU GMP Annex 11 illustrate why some life-science applications require stronger calibration, record, and computerized-system controls than a general commercial facility. Applicability must be assessed for the specific process. [7][8][9][10]


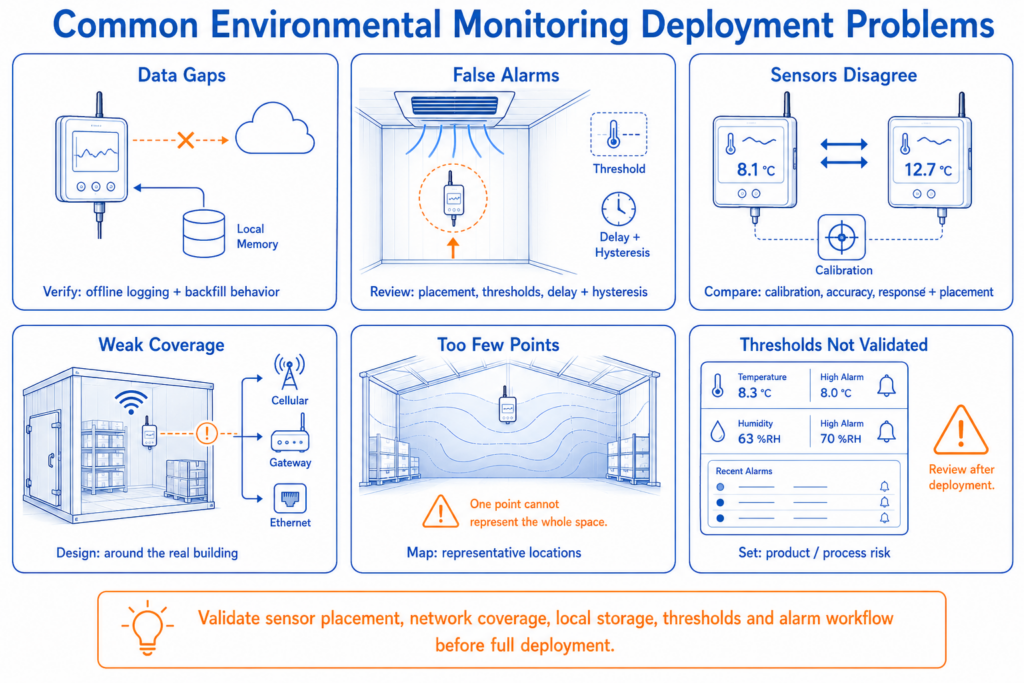
    9. What Problems Most Often Appear During Deployment?

    Problem Typical technical cause Correct handling principle
    Data gaps during network outages No local buffer, insufficient memory, gateway/backhaul failure Verify offline logging duration, backfill behavior, timestamps, and how missing data are flagged.
    Frequent false alarms Threshold too tight, sensor placed in direct airflow, short alarm delay, unsuitable probe response Review placement, process variability, alarm delay/hysteresis, and the monitored object’s real risk.
    Two sensors disagree Different accuracy limits, calibration status, response time, placement, or thermal self-heating Co-locate under stable conditions, compare against a traceable reference where needed, and evaluate uncertainty rather than matching display digits.
    Wi-Fi devices disconnect Coverage, channel congestion, enterprise authentication, metal rooms, DHCP/firewall policy Survey the actual installation area and verify the device’s supported security/network requirements before deployment.
    Alerts arrive too late Long sample/upload intervals, network delay, escalation design Measure end-to-end alarm latency and set intervals according to the speed and consequence of the hazard.
    Reports exist but are not audit-ready Weak user roles, missing calibration/configuration history, unclear system of record Define record ownership, retention, user permissions, change control and review procedure before relying on the system for regulated decisions.


    Troubleshooting infographic showing common environmental monitoring deployment problems including data gaps, false alarms, sensor disagreement and poor placement.

    Troubleshooting infographic showing common environmental monitoring deployment problems including data gaps, false alarms, sensor disagreement and poor placement.

    10. Frequently Asked Questions

    What is an environmental monitoring system?

    It is a combination of sensors, data loggers or edge devices, communications, data storage, software, alarms, and operating procedures used to record environmental conditions over time. The exact parameters depend on the application. A warehouse may need temperature and humidity, while an office may add CO2, PM2.5, and TVOC.

    What is the difference between an environmental monitor and an environmental monitoring system?

    A monitor is usually one device or sensing endpoint. A monitoring system includes the wider data chain: multiple devices, network connections, local or cloud storage, dashboards, alerts, reporting, user access, and sometimes APIs or control interfaces. Buying a monitor does not automatically create a reliable system.

    Does an environmental monitoring system need the cloud?

    No. Cloud platforms are convenient for remote access and multi-site management, but on-premises software and local systems are also valid architectures. The better choice depends on IT policy, data residency, availability, integration, and regulated-system requirements.

    Can environmental monitoring continue if Wi-Fi goes down?

    Yes, if the endpoint or gateway has local storage and is designed to keep sampling offline. Buyers should verify how long data can be retained, whether records backfill automatically after reconnection, and whether timestamps and missing-data events remain clear.

    How many sensors does a facility need?

    There is no universal number. Sensor count should follow room size, spatial variability, process risk, critical equipment, airflow, doors, rack height, and the consequence of missing an excursion. For controlled storage, mapping or a documented risk assessment is more defensible than a fixed sensor-per-area rule.

    How often should environmental data be recorded?

    The interval should be fast enough to capture a meaningful excursion but not so short that it creates unnecessary power and data costs. The right setting depends on process dynamics, alarm response time, sensor response, regulatory expectations, and how long a brief excursion can be tolerated.

    Is an environmental monitoring system automatically compliant with 21 CFR Part 11 or GMP?

    No. A product can provide functions that support electronic records, audit trails, user controls, calibration, or reporting, but compliance depends on the complete regulated process, intended use, validation, procedures, training, configuration, and applicable rules. FDA Part 11 applies only in defined electronic-record contexts. [9][10]

    Conclusion

    An environmental monitoring system works by converting physical conditions into time-stamped records, preserving those records through a reliable data path, and turning exceptions into information that people can act on. The most useful selection rule is therefore not ‘which sensor is best?’ but ‘which complete measurement and data architecture matches this site’s risks?’ Define the parameters, accuracy and calibration needs, point count, network conditions, local storage requirement, alarm response, reporting, and integration before choosing hardware. For small sites, direct-connect devices can keep infrastructure simple. For many distributed points or regulated enterprise workflows, gateway-based or governed systems may justify their additional complexity. In every case, measurement quality, data continuity, and operational response matter more than a long feature list.

    Source and Scope Notes

    Product specifications and software functions were checked against manufacturer documentation available in August 2026. Exact functions can vary by model, region, probe, firmware, software release, license, or subscription. Standards and regulatory references are included to explain system-design considerations; this article is not legal, regulatory, validation, calibration, or quality-assurance advice. For purchasing or regulated use, verify the current official datasheet, intended-use documentation, calibration scope, software version, and local requirements.

    Official References

    [1] UbiBot. WS1 Pro Specifications. https://www.ubibot.com/ubibot-ws1pro-specifications/

    [2] UbiBot. AQS1 Specifications. https://www.ubibot.com/ubibot-aqs1-specifications/

    [3] UbiBot. GS1 Specifications. https://www.ubibot.com/ubibot-gs1-specifications/

    [4] UbiBot. UbiBot IoT Platform. https://www.ubibot.com/big-data-platform/

    [5] UbiBot. GS1 Support – offline data and platform features. https://www.ubibot.com/ubibot-gs1-support/

    [6] ISO. ISO 14001:2026 Environmental management systems – Requirements with guidance for use. https://www.iso.org/standard/14001

    [7] World Health Organization. Model guidance for the storage and transport of time- and temperature-sensitive pharmaceutical products (TRS 961, Annex 9). https://www.who.int/docs/default-source/medicines/norms-and-standards/guidelines/distribution/trs961-annex9-modelguidanceforstoragetransport.pdf

    [8] U.S. CDC. Vaccine Storage and Handling Toolkit, 2026 update. https://stacks.cdc.gov/view/cdc/258326

    [9] U.S. FDA. Part 11, Electronic Records; Electronic Signatures – Scope and Application. https://www.fda.gov/regulatory-information/search-fda-guidance-documents/part-11-electronic-records-electronic-signatures-scope-and-application

    [10] European Commission. EudraLex Volume 4, Annex 11: Computerised Systems. https://health.ec.europa.eu/document/download/8d305550-dd22-4dad-8463-2ddb4a1345f1_en


    Related Resources

    UbiBot vs Eupry vs Dickson vs ELPRO: Which Remote Temperature Monitoring System Fits Your Site?
    How to Monitor Pharmaceutical Cold Chain Shipments from Warehouse to Delivery?
    University of Alberta Study Uses UbiBot WS1 Pro to Monitor Environmental Conditions in Hydroponic Lettuce Production
    National University of Singapore Study Uses UbiBot WS1 Pro for Surface Temperature Calibration in District-Scale Thermal Infrared Monitoring
    Polish Academy of Sciences Study Uses UbiBot WS1 Pro to Monitor Temperature and Humidity During PM Filter Conditioning
    UbiBot vs HOBO vs SensorPush vs Testo: Which Museum Room Monitor Fits Your Collection?
    Polish Academy of Sciences Study Uses UbiBot WS1 Pro to Monitor Temperature and Humidity During Particulate Matter Filter Conditioning
    Empa-Led Study Uses UbiBot WS1 Pro for Temperature and Humidity Monitoring in Passive Cooling Blanket Trials Across Kenya, Uganda, and Nigeria
    menu-header-svg
    Search
    • Explore Knowledge
      • Comparison & Selection
      • Industry Solution
      • Product & Device
      • Criterion & Compliance
      • Deployment & Usage
      • Technology & Principle
    • Academic Research
    • In-depth Tech

    Technology & Principle

    See More >>

    What Is an Environmental Monitoring System and How Does It Work?

    Introduction

    An environmental monitoring system turns changing physical conditions into records that people can review, act on, and integrate with operations. For a facility manager, that may mean tracking temperature and humidity across storage rooms. For a laboratory, it may include refrigerators, CO2, pressure, and alarm history. For a smart building, the same idea can extend to particulate matter, volatile organic compounds, light, and ventilation-related indicators. The common mistake is to think the system is just a sensor. In practice, reliable monitoring depends on an end-to-end chain: sensing, signal conversion, data logging, connectivity, local retention, software, alarms, reporting, and maintenance. This article explains how that chain works, how common architectures differ, and how to select a system for a real site rather than from a feature list alone.

    Environmental monitoring system overview showing sensors, data loggers, connectivity, cloud dashboards, alerts and reports across real-world sites.

    Environmental monitoring system overview showing sensors, data loggers, connectivity, cloud dashboards, alerts and reports across real-world sites.

    30-Second Summary

    Question Core answer
    What is it? A connected system that measures environmental conditions, records them over time, and turns exceptions into visible alarms, reports, or actions.
    What does it usually measure? Temperature and humidity are common; CO2, PM2.5, TVOC, pressure, light, leaks, door status, and external probe data may be added when the application requires them.
    What are the main layers? Sensors -> device or data logger -> connectivity -> local/cloud platform -> alarms, reports, APIs, and operational response.
    Does every site need a gateway? No. Wi-Fi, Ethernet, or cellular devices can connect directly. Long-range radio and some proprietary wireless architectures usually use a gateway or access point.
    What protects data during an outage? On-device memory, buffering, battery backup, time synchronization, and verified backfill behavior are more important than a dashboard that is merely online.
    What should buyers compare first? Measurement requirements, point count, network conditions, local data retention, alarm workflow, calibration, integration, and lifecycle cost – not a single accuracy number.


    One-sentence selection rule:

    Choose the system architecture from the measurement risk, number of points, network conditions, local data-retention needs, alarm workflow, calibration plan and integration requirements – not from one headline specification.


    1. Why Do You Need an Environmental Monitoring System?

    The immediate reason for environmental monitoring is simple: manual spot checks cannot describe what happened between inspections. A room can drift out of range for an hour and recover before the next walkthrough. A refrigerator can cycle abnormally overnight. A greenhouse zone can overheat while another remains stable. A server room can develop a local hot spot even when the wall thermostat looks normal. Continuous or scheduled logging creates a time series that makes these events visible.

    The technology also reduces fragmented records. Instead of temperature on one handheld meter, humidity on another, and air-quality data in a separate app, a monitoring platform can combine multiple parameters and locations into one operational view. That does not mean every project should monitor everything. Each parameter should answer a defined risk or operating question.

    The term also needs a boundary. In this article, an environmental monitoring system means a sensing and data system for physical conditions in facilities, storage areas, laboratories, buildings, agriculture, and similar operational environments. It is not the same as an environmental management system under ISO 14001. ISO 14001:2026 is a management-system standard for organizational environmental performance; it is broader than room or asset monitoring. [6]

    2. What Makes Up the Complete System and Data Path?

    A complete environmental monitoring system is best understood as a data chain rather than a single device. The chain usually contains five functional layers.

    The sensing layer converts a physical condition into an electrical or digital measurement. Temperature may come from a thermistor, RTD, or digital sensor; CO2 may come from an NDIR sensor; particulate matter is commonly estimated optically. The important point is that the sensor has a defined range, accuracy specification, response behavior, and environmental limits.

    The device or edge layer reads those sensors, time-stamps the data, applies calibration or compensation settings where supported, stores records locally, and decides when to transmit. A data logger may also accept external probes, RS485 instruments, dry contacts, or analog inputs. This layer is where sampling interval, battery behavior, local memory, and device health become practical design issues.

    The connectivity layer carries data beyond the device. Wi-Fi is convenient where managed local networks are reliable. Ethernet is useful for fixed infrastructure and can reduce radio uncertainty. Cellular is useful for remote or mobile sites and can provide an independent route. Long-range radio architectures can reduce wiring across large facilities but normally add a gateway or access-point dependency. RS485 is different: it is a local wired bus used to connect sensors or instruments to a logger, controller, or gateway; it is not an Internet connection by itself.

    The platform layer stores and organizes the data. A cloud or on-premises platform may provide dashboards, device grouping, historical charts, user permissions, alarm rules, exports, and system status. Finally, the response and integration layer connects the measurements to people and other systems through notifications, scheduled reports, REST APIs, MQTT or HTTP interfaces, data forwarding, relays, or workflow tools. A technically complete design therefore follows the path: measurement -> record -> transmission -> retention -> interpretation -> response.

    Environmental monitoring data path from sensing and local logging through connectivity to cloud storage, alerts, reports and integrations.

    Environmental monitoring data path from sensing and local logging through connectivity to cloud storage, alerts, reports and integrations.

    3. How Does an Environmental Monitoring System Work?

    The core technology is a repeating measurement-and-decision cycle. First, a sensor samples the environment. The device converts the raw signal into an engineering value such as degrees Celsius, percent relative humidity, parts per million, micrograms per cubic meter, or lux. The device then assigns a timestamp and stores the record. Sampling can occur much more frequently than cloud upload; separating those two intervals can preserve useful detail without forcing the radio to remain active continuously.

    Next, the device decides how to move the data. A direct-connect Wi-Fi or cellular logger can send records straight to a remote platform. A long-range node may send them to a local gateway, which forwards them over Ethernet, Wi-Fi, or cellular backhaul. A wired RS485 sensor may feed a local logger that performs the Internet-facing work. The communication method changes the infrastructure, but the application requirement stays the same: records must arrive with enough context to show what was measured, where, when, and by which device.

    Local storage is a key reliability mechanism. Network availability and measurement availability are not the same thing. A well-designed logger should continue recording when the network fails and provide a defined method for later synchronization or manual export. UbiBot, for example, publishes 300,000-record onboard memory for WS1 Pro, AQS1, and GS1 models, and its support documentation describes continued local collection during Wi-Fi outages with later synchronization or offline export. [1][2][3][5] Other systems use different retention models; Vaisala RFL100 specifies 30 days or 43,200 samples per channel at its fixed one-minute sampling rate. [6]

    The platform then evaluates rules against the incoming stream. A threshold alarm is the simplest example, but effective monitoring also needs device-health awareness: communication loss, low battery, probe failure, stale data, and power loss can be as important as a high-temperature event. Alarm latency is determined by more than the sensor response time. It includes the sampling interval, upload interval, network path, server processing, notification channel, and human escalation process. Calling a system ‘real time’ does not remove these delays; buyers should verify the actual end-to-end behavior they require.

    4. What Are the Main Technology Routes?

    Most environmental monitoring projects fall into four architecture families. None is universally superior.

    Direct-connect wireless systems use Wi-Fi or cellular at the monitoring device. They are attractive for small and medium sites because each logger can reach the platform without a proprietary gateway. The trade-off is that every endpoint depends on suitable local Wi-Fi or cellular coverage and must manage its own radio power budget.

    Gateway-based wireless systems use a local radio link between endpoint loggers and an access point or gateway. This can provide long range, better penetration, or lower endpoint power. Vaisala RFL100, for example, uses VaiNet through an AP10 access point; an AP10 supports up to 32 RFL100 loggers, with a typical indoor range of at least 100 m. [6][7] The architectural trade-off is a shared infrastructure component that must be sized, powered, and monitored.

    Wired industrial systems use Ethernet, RS485/Modbus, analog inputs, or combinations of these. They fit fixed plants, equipment rooms, and sites where deterministic cabling is easier to maintain than radio. Wiring increases installation work, but it can simplify power and reduce wireless coverage problems.

    Multi-parameter indoor-air systems integrate several sensors in one enclosure. UbiBot AQS1, for example, combines temperature, humidity, atmospheric pressure, TVOC, eCO2, PM1.0/PM2.5/PM10, and CO2 channels, with Wi-Fi or 4G versions. [2] This is useful when the application needs an environmental profile rather than temperature alone, but integrated sensors should still be evaluated channel by channel because each measurement principle has its own range, accuracy, drift, and maintenance needs.

    Comparison of direct Wi-Fi or cellular, gateway-based wireless, wired industrial and multi-parameter environmental monitoring architectures.

    Comparison of direct Wi-Fi or cellular, gateway-based wireless, wired industrial and multi-parameter environmental monitoring architectures.

    5. Which Technical Parameters Affect Real-World Performance?

    Parameter What it means Why it matters in a project
    Measurement range The interval over which the sensor is specified. A probe that survives a freezer or process point may be different from the device’s own ambient operating range.
    Accuracy / uncertainty How close a measurement is expected to be under stated conditions. Compare the specified test range and conditions, not only the headline number. Regulated work may also require traceable calibration.
    Resolution The smallest displayed or recorded increment. High resolution does not guarantee high accuracy; a device can show many decimals and still have a larger measurement error.
    Response time How quickly the sensing element follows a change. Fast air sensors may react to door openings; buffered or immersed probes may better represent product temperature but respond more slowly.
    Sampling interval How often the device measures. Shorter intervals capture brief events but increase data volume and may increase power use.
    Upload interval How often records are transmitted. It affects alarm latency, bandwidth, battery life, and how much data must be buffered during outages.
    Local storage Records retained on the device or gateway. This determines how long measurement history can survive a network outage before data are overwritten.
    Connectivity and coverage Wi-Fi, Ethernet, cellular, long-range radio, or wired bus behavior. Coverage must be tested in the actual building, including racks, walls, cold rooms, metal structures, and remote zones.
    Calibration and drift How measurement performance changes and how it is checked over time. A commissioning result is not a permanent guarantee. Calibration interval should reflect sensor type, risk, environment, and quality requirements.

    The most common specification mistake is to compare unlike numbers. Accuracy is not resolution; typical performance is not the same as a maximum permissible error; a sensor’s measurement range is not the same as the logger’s operating temperature; and a communication range measured in open space is not a guarantee inside a reinforced building. For a serious project, define the required conditions first, then check whether each published specification applies under those conditions.

    6. How Should Similar Technologies Be Selected?

    Deployment condition Usually consider Decision logic
    One to a few rooms with reliable Wi-Fi Direct Wi-Fi loggers Simple infrastructure and fast deployment; confirm enterprise Wi-Fi compatibility, local buffering, and alarm path.
    Remote site or weak local IT infrastructure Cellular direct-connect Independent backhaul can simplify deployment; verify regional bands, subscription/data costs, indoor signal, and local storage.
    Large distributed facility with many points Gateway-based long-range wireless Reduces endpoint network configuration; verify gateway capacity, coverage, redundancy, and backhaul.
    Fixed industrial equipment and third-party probes Ethernet / RS485 / Modbus architecture Useful for wired integration and existing controls; define addressing, termination, polling, isolation, and gateway behavior.
    Indoor air quality or occupant environment Integrated multi-parameter monitor Convenient for CO2/PM/VOC plus temperature and humidity; check maintenance and accuracy per channel.
    Regulated or audit-sensitive workflow Governed monitoring platform with calibration, roles, audit evidence, and validated processes Select the complete system and operating procedure, not the logger alone. FDA Part 11 or EU GMP Annex 11 may become relevant when applicable electronic records are used in regulated processes. [9][10]

    Choose the architecture from the failure modes you need to tolerate. A direct Wi-Fi device can be the least complex solution for a small warehouse, but it may be a poor choice inside a metal cold room with no stable Wi-Fi. A gateway network can be excellent for many distributed sensors, but the gateway becomes part of the availability design. Ethernet can be robust, but it is expensive to add after a facility is finished. Cellular can bypass local IT, but signal quality and recurring data costs matter.

    For mixed sites, a hybrid system is often more practical than forcing one network everywhere. A facility might use Ethernet for a fixed industrial logger, Wi-Fi for office and laboratory rooms, cellular for a remote building, and RS485 probes for specialized measurement points. The platform should make those differences manageable without hiding them.

    7. Representative Environmental Monitoring Systems Compared

    The systems below solve similar monitoring problems but use different architectures and sensor portfolios. This is a system-level comparison, not a ranking of measurement accuracy. Where the measurement range depends on an external probe, the table says so rather than inventing a single system-wide value. Official information was reviewed in August 2026.

    System Type Measurement scope Published measurement figure Connectivity Local storage Platform / API Best fit
    UbiBot WS1 Pro + UbiBot IoT Platform Direct-connect environmental data logger Built-in temperature, RH and light; selected external temperature, PT100, air temperature/RH, soil and wind probes Temperature ±0.2°C at 0 to 60°C; RH ±2% at 10 to 90%RH for built-in channels [1] 2.4 GHz Wi-Fi or 4G by model; selected external sensors / RS485 interface 300,000 sensing records [1] Web/app historical data, alerts, CSV/PDF export, data forwarding and Open API functions; plan-dependent features apply [4] Small/medium storage, labs, museums, refrigerators with external probes, distributed sites
    Vaisala RFL100 + AP10 + viewLinc Gateway-based wireless continuous monitoring Temperature, humidity and CO2 according to selected Vaisala probes Probe-dependent; see the selected probe datasheet VaiNet to AP10; AP10 up to 32 loggers; typical indoor range at least 100 m [6][7] 30 days / 43,200 samples per channel at 1-minute sampling [6] Central alarms and reports; optional Web/REST API license [8] Large multi-point life-science, laboratory and controlled-storage environments
    Dickson Cobalt X + DicksonOne / OCEAView Universal touchscreen data logger Up to 4 simultaneous wired/wireless channels; temperature, RH, pressure, CO2, current, dry contact and light options [9] Depends on selected replaceable sensor LoRaWAN and Bluetooth Low Energy [9] DicksonOne comparison documentation lists 16,000 readings for Cobalt X [10] Remote monitoring, phone/text/email alarms; DicksonOne REST API available for integrations [10] Life sciences, labs, hospitals, storage and manufacturing with modular sensor needs
    testo Saveris 1 + testo 150 TUC4 Modular enterprise environmental monitoring system External digital probes plus analog options; measured range and accuracy depend on selected probes TUC4 analog NTC channel: -40 to +150°C, ±0.3°C; digital channels depend on probe [12] WLAN, LAN/PoE or testo UltraRange by communication module [11][12] Minimum 16,000 readings per channel for testo 150 TUC4 [12] Alarm management, audit trail/ERES features, reporting; REST API for third-party data retrieval and alarm forwarding [11] Pharmaceutical, laboratory and other governed monitoring projects requiring modular enterprise controls

    Measurement specifications are configuration-dependent where external probes are used.

    Architecture-level comparison of representative environmental monitoring systems, showing direct-connect, gateway-based and modular monitoring approaches.

    Architecture-level comparison of representative environmental monitoring systems, showing direct-connect, gateway-based and modular monitoring approaches.

    The main differences are architectural. UbiBot’s WS1 Pro is a direct-connect option with substantial local record capacity and can be expanded with external probes; this can reduce gateway infrastructure for small and medium deployments. UbiBot AQS1 is a better fit when indoor-air parameters such as CO2, particulate matter, TVOC, and pressure are central, while GS1 variants extend the portfolio toward industrial environments and, depending on model, Wi-Fi, 4G, Ethernet, and RS485-connected sensing. [2][3]

    Vaisala’s RFL100 approach is purpose-built around a dedicated VaiNet access-point architecture and viewLinc governance. Dickson Cobalt X emphasizes a universal logger with replaceable sensor options and LoRaWAN/Bluetooth connectivity. Testo Saveris 1 is a modular enterprise system that combines data logger and communication modules with centralized software. These are different operating models, so selection should reflect site scale, validation or governance needs, network ownership, calibration service expectations, and total lifecycle cost rather than forcing an absolute winner.

    8. How Should Different Application Scenarios Be Approached?

    Scenario Typical parameters Selection logic
    Warehouse / cold storage Temperature and humidity, door influence, external probe points Use mapping or risk assessment to locate representative points; favor local buffering and clear alarm escalation.
    Laboratory Temperature, humidity, CO2, pressure, refrigerators/freezers Separate room monitoring from equipment probes; define calibration and record ownership where data support quality decisions.
    Greenhouse / indoor farming Temperature, humidity, light, CO2, soil-related parameters Expect spatial variation; distributed wireless points and expandable probes are often more useful than one central monitor.
    Server room / data center Temperature, humidity, water leakage, airflow or equipment-state inputs Place sensors where thermal and leak risk exists, not only beside the thermostat; consider wired or Ethernet paths for fixed infrastructure.
    Museum / archive Temperature, humidity, light and sometimes air quality Prioritize stable trend data, low visual impact, placement away from direct HVAC flow, and long-term reporting.
    Smart building / office CO2, PM2.5, TVOC, temperature and humidity Use multi-parameter indoor-air monitors where ventilation and occupant environment matter; interpret each pollutant channel according to its sensing method.


    Scenario-based environmental monitoring selection guide for warehouses, laboratories, greenhouses, smart buildings, server rooms and cold storage.

    Scenario-based environmental monitoring selection guide for warehouses, laboratories, greenhouses, smart buildings, server rooms and cold storage.


    Regulated-use note:

    WHO storage guidance, the CDC Vaccine Storage and Handling Toolkit, FDA Part 11, and EU GMP Annex 11 illustrate why some life-science applications require stronger calibration, record, and computerized-system controls than a general commercial facility. Applicability must be assessed for the specific process. [7][8][9][10]


    9. What Problems Most Often Appear During Deployment?

    Problem Typical technical cause Correct handling principle
    Data gaps during network outages No local buffer, insufficient memory, gateway/backhaul failure Verify offline logging duration, backfill behavior, timestamps, and how missing data are flagged.
    Frequent false alarms Threshold too tight, sensor placed in direct airflow, short alarm delay, unsuitable probe response Review placement, process variability, alarm delay/hysteresis, and the monitored object’s real risk.
    Two sensors disagree Different accuracy limits, calibration status, response time, placement, or thermal self-heating Co-locate under stable conditions, compare against a traceable reference where needed, and evaluate uncertainty rather than matching display digits.
    Wi-Fi devices disconnect Coverage, channel congestion, enterprise authentication, metal rooms, DHCP/firewall policy Survey the actual installation area and verify the device’s supported security/network requirements before deployment.
    Alerts arrive too late Long sample/upload intervals, network delay, escalation design Measure end-to-end alarm latency and set intervals according to the speed and consequence of the hazard.
    Reports exist but are not audit-ready Weak user roles, missing calibration/configuration history, unclear system of record Define record ownership, retention, user permissions, change control and review procedure before relying on the system for regulated decisions.


    Troubleshooting infographic showing common environmental monitoring deployment problems including data gaps, false alarms, sensor disagreement and poor placement.

    Troubleshooting infographic showing common environmental monitoring deployment problems including data gaps, false alarms, sensor disagreement and poor placement.

    10. Frequently Asked Questions

    What is an environmental monitoring system?

    It is a combination of sensors, data loggers or edge devices, communications, data storage, software, alarms, and operating procedures used to record environmental conditions over time. The exact parameters depend on the application. A warehouse may need temperature and humidity, while an office may add CO2, PM2.5, and TVOC.

    What is the difference between an environmental monitor and an environmental monitoring system?

    A monitor is usually one device or sensing endpoint. A monitoring system includes the wider data chain: multiple devices, network connections, local or cloud storage, dashboards, alerts, reporting, user access, and sometimes APIs or control interfaces. Buying a monitor does not automatically create a reliable system.

    Does an environmental monitoring system need the cloud?

    No. Cloud platforms are convenient for remote access and multi-site management, but on-premises software and local systems are also valid architectures. The better choice depends on IT policy, data residency, availability, integration, and regulated-system requirements.

    Can environmental monitoring continue if Wi-Fi goes down?

    Yes, if the endpoint or gateway has local storage and is designed to keep sampling offline. Buyers should verify how long data can be retained, whether records backfill automatically after reconnection, and whether timestamps and missing-data events remain clear.

    How many sensors does a facility need?

    There is no universal number. Sensor count should follow room size, spatial variability, process risk, critical equipment, airflow, doors, rack height, and the consequence of missing an excursion. For controlled storage, mapping or a documented risk assessment is more defensible than a fixed sensor-per-area rule.

    How often should environmental data be recorded?

    The interval should be fast enough to capture a meaningful excursion but not so short that it creates unnecessary power and data costs. The right setting depends on process dynamics, alarm response time, sensor response, regulatory expectations, and how long a brief excursion can be tolerated.

    Is an environmental monitoring system automatically compliant with 21 CFR Part 11 or GMP?

    No. A product can provide functions that support electronic records, audit trails, user controls, calibration, or reporting, but compliance depends on the complete regulated process, intended use, validation, procedures, training, configuration, and applicable rules. FDA Part 11 applies only in defined electronic-record contexts. [9][10]

    Conclusion

    An environmental monitoring system works by converting physical conditions into time-stamped records, preserving those records through a reliable data path, and turning exceptions into information that people can act on. The most useful selection rule is therefore not ‘which sensor is best?’ but ‘which complete measurement and data architecture matches this site’s risks?’ Define the parameters, accuracy and calibration needs, point count, network conditions, local storage requirement, alarm response, reporting, and integration before choosing hardware. For small sites, direct-connect devices can keep infrastructure simple. For many distributed points or regulated enterprise workflows, gateway-based or governed systems may justify their additional complexity. In every case, measurement quality, data continuity, and operational response matter more than a long feature list.

    Source and Scope Notes

    Product specifications and software functions were checked against manufacturer documentation available in August 2026. Exact functions can vary by model, region, probe, firmware, software release, license, or subscription. Standards and regulatory references are included to explain system-design considerations; this article is not legal, regulatory, validation, calibration, or quality-assurance advice. For purchasing or regulated use, verify the current official datasheet, intended-use documentation, calibration scope, software version, and local requirements.

    Official References

    [1] UbiBot. WS1 Pro Specifications. https://www.ubibot.com/ubibot-ws1pro-specifications/

    [2] UbiBot. AQS1 Specifications. https://www.ubibot.com/ubibot-aqs1-specifications/

    [3] UbiBot. GS1 Specifications. https://www.ubibot.com/ubibot-gs1-specifications/

    [4] UbiBot. UbiBot IoT Platform. https://www.ubibot.com/big-data-platform/

    [5] UbiBot. GS1 Support – offline data and platform features. https://www.ubibot.com/ubibot-gs1-support/

    [6] ISO. ISO 14001:2026 Environmental management systems – Requirements with guidance for use. https://www.iso.org/standard/14001

    [7] World Health Organization. Model guidance for the storage and transport of time- and temperature-sensitive pharmaceutical products (TRS 961, Annex 9). https://www.who.int/docs/default-source/medicines/norms-and-standards/guidelines/distribution/trs961-annex9-modelguidanceforstoragetransport.pdf

    [8] U.S. CDC. Vaccine Storage and Handling Toolkit, 2026 update. https://stacks.cdc.gov/view/cdc/258326

    [9] U.S. FDA. Part 11, Electronic Records; Electronic Signatures – Scope and Application. https://www.fda.gov/regulatory-information/search-fda-guidance-documents/part-11-electronic-records-electronic-signatures-scope-and-application

    [10] European Commission. EudraLex Volume 4, Annex 11: Computerised Systems. https://health.ec.europa.eu/document/download/8d305550-dd22-4dad-8463-2ddb4a1345f1_en

    分享

    LinkedIn2

    Facebook2

    X

    Newsletter Signup

    Related Resources

    UbiBot vs Eupry vs Dickson vs ELPRO: Which Remote Temperature Monitoring System Fits Your Site?
    How to Monitor Pharmaceutical Cold Chain Shipments from Warehouse to Delivery?
    University of Alberta Study Uses UbiBot WS1 Pro to Monitor Environmental Conditions in Hydroponic Lettuce Production
    National University of Singapore Study Uses UbiBot WS1 Pro for Surface Temperature Calibration in District-Scale Thermal Infrared Monitoring
    Polish Academy of Sciences Study Uses UbiBot WS1 Pro to Monitor Temperature and Humidity During PM Filter Conditioning
    UbiBot vs HOBO vs SensorPush vs Testo: Which Museum Room Monitor Fits Your Collection?
    Polish Academy of Sciences Study Uses UbiBot WS1 Pro to Monitor Temperature and Humidity During Particulate Matter Filter Conditioning
    Empa-Led Study Uses UbiBot WS1 Pro for Temperature and Humidity Monitoring in Passive Cooling Blanket Trials Across Kenya, Uganda, and Nigeria
    menu-header-svg
    Search
    • Explore Knowledge
      • Comparison & Selection
      • Industry Solution
      • Product & Device
      • Criterion & Compliance
      • Deployment & Usage
      • Technology & Principle
    • Academic Research
    • In-depth Tech
    Enter Your Information

    Confirm

    Products

    Dashboards

    Support

    Purchase

    Company

    Smart Sensing

    UbiBot Web Console

    APP Download

    UbiBot Online Store

    News

    Smart Control

    UbiBot Space

    Product Docs & APIs

    Find Distributors

    About Us

    Smart Video

    UbiBot On-Premises

    Helpdesk & FAQ

    Volume Pricing

    Learn Hub

    LoRa Products

    Agency Web Console

    Video Center

    Contact Us

    Software & Platform


    Pricing


    Architecture

    External Sensors


    System Status

    Accessories


    Become a Distributor

    Global SIM


    Become an Affiliate

    Positioning System


    Products

    Dashboards

    Business Partners

    WS1

    UbiBot Web Console

    Volume Pricing

    WS1 Pro

    UbiBot Space

    Become a Distributor

    GS1

    UbiBot Support Desk

    Affiliates

    GS2

    Agency Web Console


    MS1


    SP1


    Accessories


    Docs

    Purchase

    Company

    Platform API

    Pricing

    News

    Q&A

    UbiBot Partners

    About us

    Privacy Policy

    Online Store

    Contact

    Terms of Service


    System Status

    Products

    Dashboards

    Smart Sensing

    UbiBot Web Console

    Smart Control

    UbiBot Space

    Smart Video

    UbiBot On-Premises

    LoRa Products

    Agency Web Console

    Software & Platform


    External Sensors


    Accessories


    Global SIM


    Positioning System


    Support

    Purchase

    APP Download

    UbiBot Online Store

    Product Docs & APIs

    Find Distributors

    Helpdesk & FAQ

    Volume Pricing

    Video Center


    Pricing


    Company

    News

    About Us

    Learn Hub

    Contact Us

    Architecture

    System Status

    Become a Distributor

    Become an Affiliate

    Language:
    English 日本語 (ベータ)  
    Language:

    English

    日本語 (ベータ)


    IoT Product Family:
    ubibotico     Wireless environmental sensing products and smart building solutions
    ubitrackico     UWB-based real-time indoor tracking solutions with 30cm accuracy

    IoT Product Family:

    ubibotico  Wireless environmental sensing products and smart building solutions
    ubitrackico  UWB-based real-time indoor tracking solutions with 30cm accuracy

    © 2013-2026 UbiBot.com. All rights reserved.

    Terms of Service | Privacy Policy | Compliance

    youtube facebook twitter