

.svg)
How Many Sensors Does a Greenhouse Really Need?
Published: September 14, 2026
Update: September 14, 2026
By Frank Hill
A greenhouse can have excellent climate-control equipment and still make poor decisions if its sensors do not represent what the crop is actually experiencing. One temperature and humidity sensor near the center may look reasonable, but a greenhouse is rarely uniform. Solar exposure, vents, heaters, evaporative pads, circulation fans, crop height, irrigation blocks, and CO2 injection can create microclimates that differ by location and time.
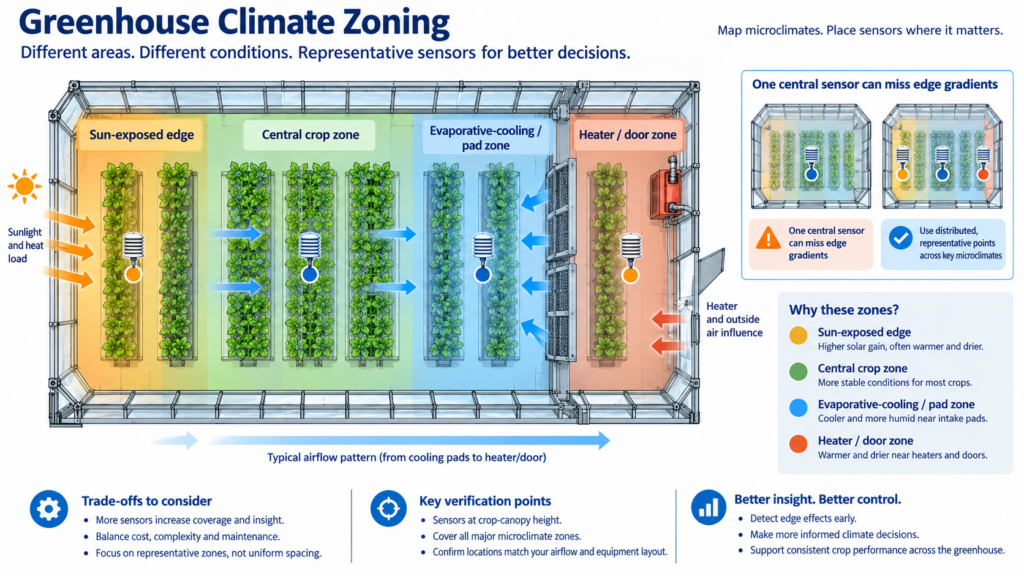
Greenhouse climate zoning layout showing representative temperature and humidity sensors across independently controlled microclimate zones.
That is why the practical answer to “how many sensors in a greenhouse?” is not a fixed number per square meter. The sources reviewed do not prescribe a universal sensor-density rule. Research instead shows that the required number depends on spatial variability, the purpose of monitoring, and how many climate-control zones must be represented. In one 2023 greenhouse study, eight sensor locations were selected from 56 temperature/humidity nodes for effective monitoring and control; a 2026 field study using 40 temperature sensors found that three to six optimized nodes could reconstruct the measured temperature field in that specific greenhouse. These are case studies, not transferable sizing rules, but they show why zoning and validation matter more than equal spacing alone. [1][2]
This article explains how to size a greenhouse sensor network, where sensors should be placed, which parameters deserve their own monitoring points, how LoRa and other wireless architectures affect deployment, and how representative commercial systems differ.
How Many Sensors in a Greenhouse? 30-Second Answer
| Question | Direct answer |
| Is there a standard number of sensors per greenhouse? | No universal number was found in the sources reviewed. Count independent climate zones and monitoring objectives, then validate the layout with temporary mapping. |
| What is the minimum starting point? | A practical starting point is one representative temperature/RH node per independently controlled climate zone, plus additional points for known gradients or critical areas. This is an engineering heuristic, not a regulatory rule. |
| Should sensors be equally spaced? | Not automatically. Equal spacing can miss hot spots, cold zones, fan discharge, solar edges, or different irrigation blocks. |
| Does every zone need CO2, light, and soil sensors? | Only where those variables are independently controlled or materially affect crop decisions. T/RH is usually the baseline; CO2, PAR, substrate moisture, and plant sensors are added by objective. |
| Where should a T/RH sensor be mounted? | At a representative crop-canopy location, shielded from direct radiant heat and away from local disturbances unless that disturbance is intentionally being monitored. |
| When is LoRa useful? | When many battery-powered nodes must cover a large greenhouse or multiple bays without dense Wi-Fi coverage or extensive cabling. |
| How do you know the final count is enough? | Compare nodes during a mapping period. If locations that drive the same control zone show materially different behavior, split the zone or add monitoring points. |
Selection takeaway
Start with climate zones, not floor area. Use one representative T/RH point per independent control zone as a baseline, then add sensors only where mapping, control logic, crop risk, or parameter-specific decisions justify them.
Why One Greenhouse Sensor Is Often Not Enough
A single sensor can be accurate yet still be unrepresentative. The core problem is spatial heterogeneity: temperature and humidity are not distributed uniformly inside most greenhouses. Air enters and leaves at specific points, solar radiation varies across roofs and sidewalls, heaters and pads create gradients, and a growing crop changes airflow and latent heat exchange over the season.
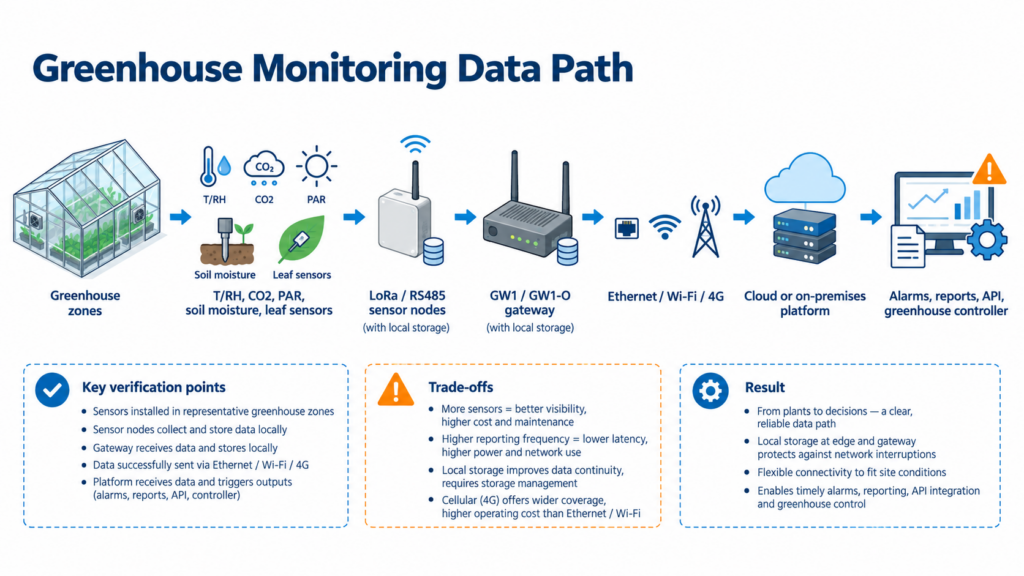
Greenhouse monitoring data path from distributed sensors through LoRa gateway to cloud or on-premises platform.
Sensor-placement research reflects this. A 2019 greenhouse study found that different positions can serve different purposes: some locations best represent the facility average, while others are more useful for detecting unstable or poorly controlled regions. A 2026 temperature-distribution study also reported meaningful spatial differences and showed that sensor placement can change the conclusions drawn from greenhouse data. [2][3]
The design question is therefore not “How many devices can I afford?” but “How many independent microclimates must the control system see?” If two bays use different heating loops, curtain schedules, crop stages, or irrigation strategies, they may need separate monitoring even if they share the same building. Conversely, two areas with highly correlated conditions may not need duplicate permanent sensors once mapping confirms they behave as one zone.
What Does a Complete Greenhouse Monitoring Data Path Look Like?
A scalable greenhouse monitoring system separates sensing, local data collection, wireless transport, backhaul, and platform functions. A typical path is:
Typical data path: Greenhouse microclimate -> T/RH, CO2, PAR, soil/substrate, or plant sensor -> sensor node/logger -> LoRa, wired RS485, Wi-Fi, Bluetooth, or cellular link -> gateway/backhaul -> cloud or on-premises platform -> dashboards, alerts, reports, APIs, and control-system integration.
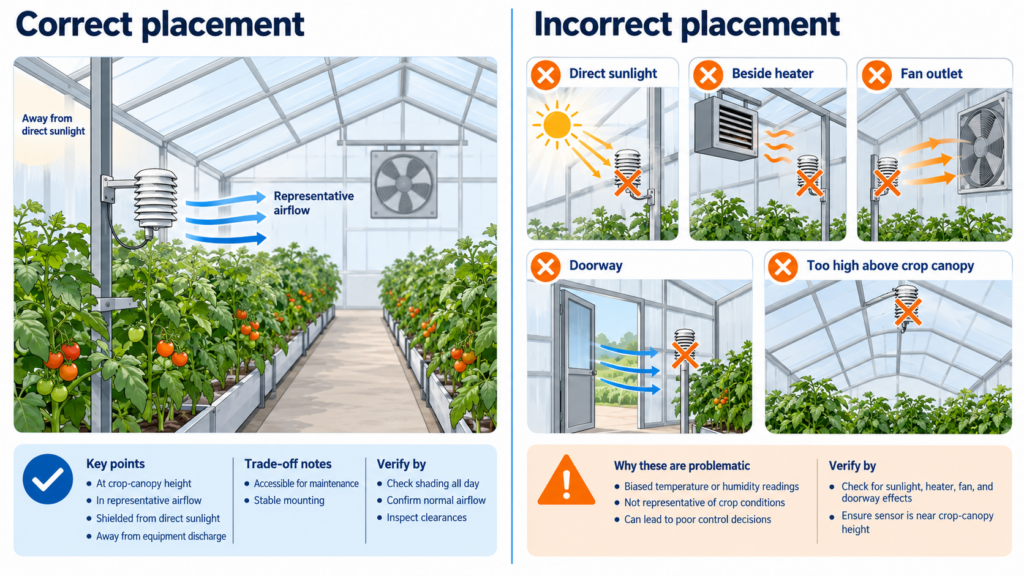
Correct versus incorrect greenhouse temperature and humidity sensor placement around crop canopy, fans, doors, heaters, and direct sunlight.
This separation matters because each layer solves a different problem. The sensor determines what physical quantity is measured. The node timestamps and stores data. The local wireless link determines how easily many points can be deployed. The gateway or cellular modem determines how data leaves the greenhouse. The platform turns readings into trends, alerts, summaries, and integrations.
For a gateway-based LoRa design, the greenhouse may contain many low-power sensor nodes while only one or a few gateways need Ethernet, Wi-Fi, or cellular backhaul. UbiBot’s GW1 and GW1-O gateways follow this pattern. The indoor GW1 supports Wi-Fi and Ethernet, with a 4G variant available; the outdoor GW1-O is IP65 and offers Ethernet plus either Wi-Fi or cellular networking depending on model. Both list 300,000 sensing records of gateway storage. [6][7]
How Greenhouse Sensor Zoning and Placement Actually Work
The most defensible sensor count comes from a zone-and-validate method. Define the zones that can behave differently, place sensors where they represent the crop rather than the equipment, then use data to decide whether zones can be merged or must be split.
Start with independently controlled climate zones
A “zone” is not simply a geometric rectangle. It is an area expected to respond similarly to the same environmental drivers. Different vent groups, heating circuits, cooling pads, shading curtains, greenhouse bays, crop heights, irrigation blocks, or CO2 distribution lines can all create separate zones. If two areas are controlled independently, they should usually be observable independently as well.
Use temporary mapping before fixing the permanent layout
Temporary mapping means deploying more sensors than you expect to keep, collecting data through representative day/night and weather conditions, and comparing the resulting time series. Correlated locations can sometimes be represented by fewer permanent points. Locations that repeatedly diverge reveal a real gradient, a control problem, or a separate zone. This approach is consistent with published greenhouse placement studies that optimize a smaller permanent network from denser measurement campaigns. [1][2][3]
Place temperature and humidity sensors where the crop experiences the air
For crop-climate control, T/RH sensors should normally represent the plant canopy, not the roof structure, a wall, or the discharge of a heater or fan. As the crop grows, the representative height may change. Sencrop’s current Thermocrop 4G installation guidance similarly advises positioning the protected temperature/humidity sensing element according to where data are needed, such as near the ground, within foliage, or near shoots, while keeping the communications box positioned for good reception.
Radiation protection is equally important. A sensor exposed to direct or reflected solar radiation can read warmer than the surrounding air. Greenhouse-specific sensors such as Aranet’s T/RH unit with radiation shield explicitly use passive shielding to reduce solar-radiation error.
Do not treat every parameter as if it needs the same density
Temperature and humidity are usually the baseline because they vary across most greenhouse spaces and drive derived values such as dew point and vapor-pressure deficit (VPD). CO2 sensors are most valuable where CO2 is injected or separately controlled, because concentration can vary with distribution and ventilation. PAR sensors are most useful where lighting or shading differs by zone. Soil or substrate moisture probes should follow irrigation zones and crop blocks, not greenhouse floor area. Leaf temperature or leaf-wetness sensors are specialized tools for plant stress, VPD, irrigation, and disease-risk questions.
This distinction prevents sensor count from exploding unnecessarily. One greenhouse may need six T/RH nodes, two CO2 points, one PAR sensor per lighting zone, and several substrate probes across irrigation blocks; another may need a very different mix. The number of sensing points should follow decisions the grower intends to make.
Which Sensor and Network Technologies Are Commonly Used?
| Technology | How it works | Strengths | Limits |
| Wired RS485 / Modbus | Sensors share a wired bus to a controller or gateway. | Stable communications, deterministic addressing, useful for fixed infrastructure and multi-parameter industrial probes. | Cable routing, lightning/grounding, and expansion effort can be limiting in large or changing houses. |
| LoRa / sub-GHz gateway network | Battery-powered nodes send small packets over long-range sub-GHz radio to a gateway. | Good for many distributed nodes, low power, less dependence on greenhouse Wi-Fi. | Requires gateway planning; metal structures, wet biomass, and greenhouse geometry still affect RF performance. |
| Wi-Fi sensor network | Each node connects directly to the facility WLAN. | Direct IP connectivity and fast deployment where coverage is strong. | Power consumption and WLAN coverage/credential management can become difficult at scale. |
| Bluetooth data loggers | Loggers store data locally and are configured/downloaded by nearby phone or gateway. | Simple, inexpensive, strong local logging. | Shorter range and remote visibility usually depend on an added gateway. |
| Cellular ag-weather station | Each station uses mobile connectivity to send data to a cloud service. | Independent of local IT; useful for remote or distributed sites. | Subscription, signal coverage, and per-station modem/power design must be considered. |
Many commercial greenhouses use a hybrid architecture. An external weather station may characterize outside conditions, LoRa nodes may cover internal zones, wired RS485 probes may handle soil or industrial measurements, and the greenhouse controller may receive selected data through APIs or another integration layer.
Which Parameters Most Affect Sensor-Network Performance?
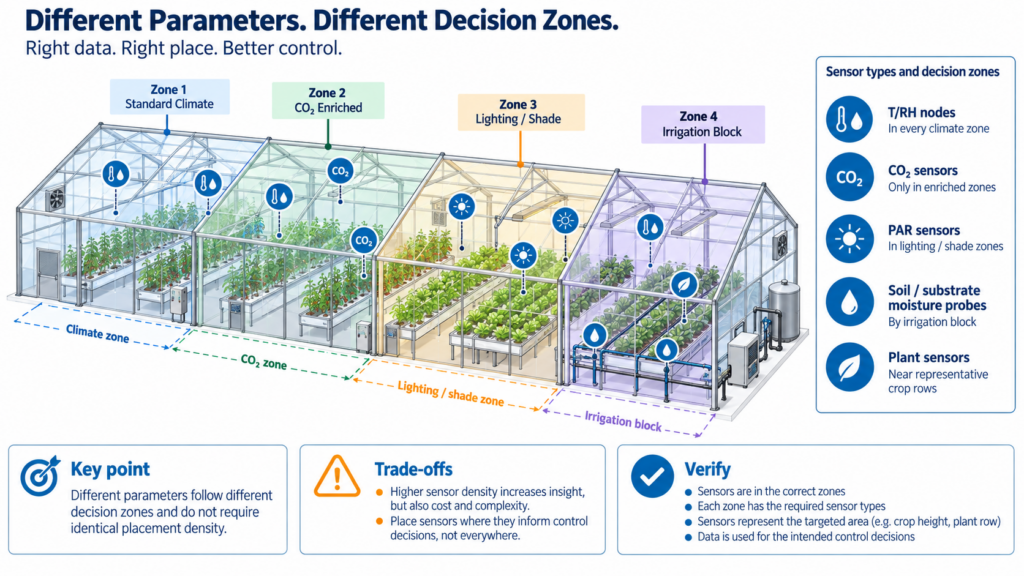
Multi-parameter greenhouse sensor network showing T/RH, CO2, PAR, soil moisture, and plant sensors mapped to different control zones.
Accuracy, resolution, and drift
Accuracy describes how close a reading is expected to be to the reference under stated conditions. Resolution is only the smallest reporting increment. Long-term drift describes how the sensor changes over time. A display with more decimal places does not automatically provide a more accurate climate signal. High-humidity greenhouses also make drift and condensation behavior important, so the stated accuracy conditions must be read carefully.
Response time and radiation error
A slow or poorly ventilated enclosure can delay recognition of real changes. At the same time, an unshielded sensor can respond to radiant heat rather than air temperature. The goal is not simply the fastest sensor, but a sensor assembly whose response represents the control variable of interest.
Sampling and logging interval
Greenhouse control changes over minutes, not just daily averages. A short interval reveals door openings, vent cycles, heater operation, CO2 injection, irrigation effects, and cloud transients. Very short intervals also increase data volume and power use. Choose an interval that is faster than the process you need to detect, then confirm the logger and platform can retain the required history.
Radio range is not the same as usable greenhouse coverage
Manufacturers usually publish line-of-sight range. Greenhouse frames, water-rich plant canopies, equipment rooms, and metal screens can reduce real range. Range should therefore be verified with a site survey or pilot deployment. Aranet publishes up to 3 km line-of-sight for its greenhouse T/RH sensor, while Davis publishes up to 300 m for Vantage Pro2 wireless transmission. Those figures should not be treated as guaranteed greenhouse coverage.
Local memory and outage recovery
Local storage is valuable because greenhouse networks fail in layers: a sensor-to-gateway link can drop, the site internet can fail, or a cloud service can be unreachable. UbiBot GS1-L and WS1 Pro-L each list 50,000 sensing records of local storage, while the GW1 family lists 300,000 records at the gateway. This supports a layered design in which data collection can continue during temporary network outages. [4][5][6]
How Should You Decide the Number of Sensors?
| Use case | Baseline design logic | When to add more |
| Single uniform control zone | 1 representative T/RH node as a starting point, then validate with mapping. | Add a second permanent point if mapping reveals repeatable gradients, if a single sensor drives high-value control decisions, or if redundancy is required. |
| Multiple independently controlled bays/zones | At least one representative T/RH point per independent zone. | Add hotspot/edge points where solar load, doors, heating, pads, or vents create persistent divergence. |
| CO2-enriched greenhouse | CO2 sensing per independently controlled/enriched zone, positioned to represent crop exposure. | Add points if mapping shows stratification or poor mixing; do not place directly in the injection jet unless that is the measurement objective. |
| Lighting or shading zones | PAR sensor per lighting/shading zone when PPFD or DLI drives decisions. | A single PAR sensor may be enough for a uniform zone; multiple points are justified when fixtures, glazing, curtains, or crop height create known differences. |
| Irrigation/substrate monitoring | Probe groups by irrigation zone, substrate type, crop block, or representative emitter behavior. | Use multiple probes where root-zone variability is high; a single central probe rarely represents every slab, pot, or soil bed. |
| Research / commissioning / troubleshooting | Temporary dense sensor grid. | Use dense data to identify stable representative locations; reduce the permanent count only after the spatial pattern is understood. |
This table is a design framework, not an industry-mandated sensor density. The only defensible way to turn it into a final number is to define the greenhouse control zones, map representative operating conditions, and set an acceptable difference between locations. If two points consistently behave the same for the purpose of control, one may be redundant. If they diverge enough to change control decisions, they are not one zone in practice.
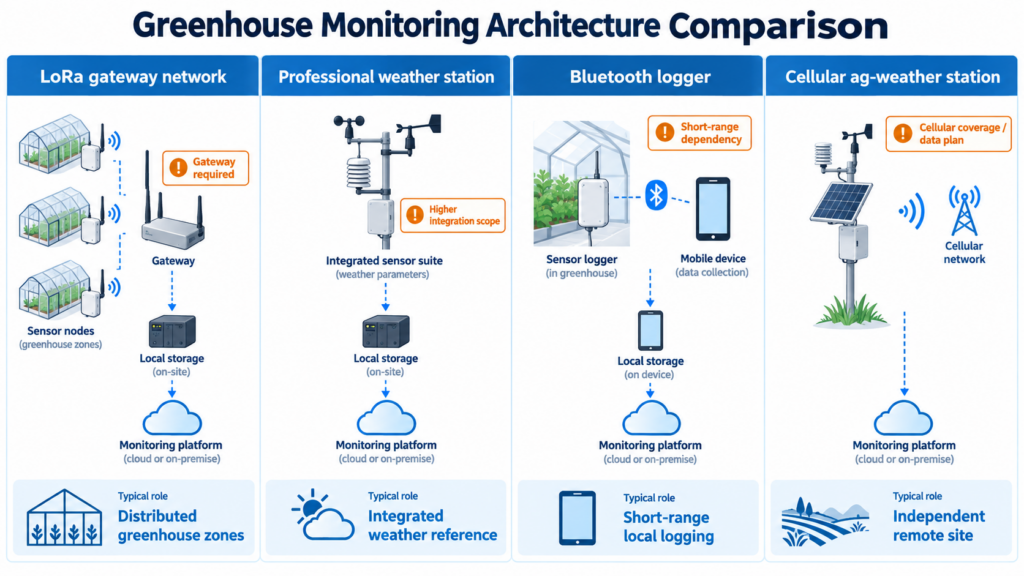
Comparison of LoRa gateway network, agricultural weather station, Bluetooth logger, and cellular greenhouse monitoring architectures.
Representative Greenhouse Monitoring Systems Compared
The products below are not identical hardware. They represent different greenhouse and agricultural monitoring architectures: gateway-based sub-GHz sensing, professional weather stations, standalone Bluetooth loggers, and cellular ag-weather platforms. Comparing them as if they were interchangeable would be misleading, so the table focuses on architecture, verified sensing performance, connectivity, and typical fit.
| System | Architecture | Verified sensing/specs | Connectivity | Data/platform | Best fit |
| UbiBot GW1GW1-O + GS1-L / WS1 Pro-L / LoRa nodes | Gateway-based LoRa greenhouse network | GS1-L / WS1 Pro-L built-in T: -20 to 60°C, ±0.2°C (0 to 60°C); RH: 0 to 100% RH, ±2% RH (10 to 90% RH). DC1-L-CO2: 400 to 10,000 ppm, ±(30 ppm + 3%) over that stated range. | LoRa nodes -> GW1/GW1-O; gateway backhaul via Ethernet/Wi-Fi and model-dependent 4G. GW1-O IP65. | Node memory 50,000 records; gateway memory 300,000. UbiBot cloud, REST APIs/data forwarding, optional on-premises platform. | Multi-zone greenhouse monitoring where T/RH, CO2, soil, light, and other RS485 sensors must share one scalable platform. [4]-[10] |
| Aranet PRO + T/RH Sensor with Radiation Shield | Sub-GHz gateway + greenhouse-specific wireless sensors | T: -40 to 60°C, ±0.3°C; RH: 0 to 100%, ±2% (accuracy conditions noted in datasheet); sensor range up to 3 km line-of-sight. | Aranet sub-GHz sensor network to PRO gateway; gateway supports Ethernet and Wi-Fi. | PRO gateway supports up to 100 sensors and local packet caching; Aranet Cloud available. | Strong dedicated horticulture ecosystem with greenhouse T/RH, PAR, plant temperature, soil/substrate, weight, and other sensors. |
| Davis Vantage Pro2 / GroWeather | Professional weather station / agricultural reference station | Measures temperature/RH, wind, rain; GroWeather adds solar radiation. Wireless transmission up to 300 m line-of-sight; temperature updates every 10 s, humidity every 1 min. | Frequency-hopping wireless sensor suite to console / WeatherLink / EnviroMonitor receivers. | WeatherLink console/cloud and historical graphing; expansion with additional special-purpose stations. | Best suited as an external weather reference or whole-site ag-weather station rather than a dense internal greenhouse microclimate network. |
| Onset HOBO MX2301A | Standalone Bluetooth T/RH data logger | T: -40 to 70°C; ±0.2°C from 0 to 70°C. RH: 0 to 100%; ±2.5% typical from 10 to 90% at 25°C, max ±3.5% incl. hysteresis. | Bluetooth Low Energy, approx. 30.5 m line-of-sight; optional MX Gateway accessory. | 128 KB, up to 63,488 measurements; HOBOconnect app; cloud upload possible with gateway workflow. | Research, mapping, validation, and localized greenhouse logging where high-quality local records matter more than long-range native networking. |
| Sencrop Thermocrop 4G | Cellular ag-weather T/RH station for crop-level monitoring | Current Thermocrop 4G public materials reviewed do not state detailed accuracy. Earlier 2023 Thermocrop datasheet (previous Sigfox generation) listed ±0.2°C typical / ±0.3°C max (-40 to 90°C) and ±2% RH typical / ±3% max (0 to 80°C). | Current generation uses 4G; solar charging with rechargeable battery; designed for installation in fields and under greenhouse cover. | Sencrop application with data history/export; current public materials reviewed do not state a public API specification. | Useful where independent cellular connectivity and agronomic weather workflows are preferred. Current 4G specs should be confirmed before procurement. |
UbiBot’s practical advantage is architectural flexibility rather than a single headline sensor specification. GW1/GGW1-O can aggregate distributed LoRa nodes; GS1-L and WS1 Pro-L provide local display, onboard T/RH/light sensing and external sensor support; dedicated LoRa T/RH and CO2 nodes are available; and RS485-compatible sensors extend the system to soil moisture, solar radiation, leaf conditions, and other parameters. The public platform supports REST APIs and data forwarding, while an on-premises option supports local infrastructure and enterprise integration. [4]-[10]
Aranet is especially strong where a greenhouse-specific battery sensor portfolio and long-range sub-GHz network are desired. Davis is strong as an agricultural weather reference and can be extended with leaf/soil stations. HOBO is strong for research-quality local logging and temporary mapping. Sencrop emphasizes mobile/cellular agronomic monitoring and current 4G deployment. The right choice depends on whether the project needs dense indoor zoning, external weather context, temporary validation, or autonomous field connectivity.
How Should the Design Change by Greenhouse Scenario?
Small greenhouse with one climate controller
Use one well-positioned T/RH node as the baseline, then verify uniformity with temporary mapping. If the far end, door side, or sun-exposed side behaves differently enough to change control decisions, keep a second permanent point. Add CO2 only if enrichment or ventilation decisions require it; add substrate sensors by irrigation block.
Multi-bay commercial greenhouse
Treat each independently controlled bay or climate compartment as its own measurement zone. A gateway-based wireless architecture is usually easier to expand than direct Wi-Fi on every node. Keep an external weather reference for wind, solar load, and ambient conditions, but do not substitute outdoor weather data for internal crop-zone measurements.
Greenhouse with CO2 enrichment
Place CO2 sensors where they represent crop exposure, not next to the injection point. If zones have separate dosing or ventilation, they should have separate feedback. Compare CO2 patterns with ventilation state and T/RH so low concentration is not misread as a sensor problem when the true cause is air exchange.
Greenhouse with variable lighting or shade curtains
PAR sensors should follow lighting zones or shading behavior. One ceiling-level light reading is not necessarily representative of plant-level PPFD. Where crop height changes significantly, revisit sensor height and light geometry during the season.
Research greenhouse or new facility commissioning
Start dense. A temporary grid of loggers can reveal gradients that design drawings cannot predict. After several representative cycles, keep the locations that best represent the average zones and the known extremes. This is where standalone loggers such as HOBO devices can complement a permanent network.
What Deployment Mistakes Most Often Distort Greenhouse Data?
Using one “center” sensor for the entire house
The physical center is not automatically the statistical or agronomic center. It may be representative in one season and misleading in another. Mapping is the only reliable way to verify whether one point tracks the zones that matter.
Mounting T/RH sensors in direct sun or near equipment discharge
Direct radiation, heaters, fan outlets, evaporative pads, and doors can bias readings toward a local disturbance. Keep representative sensors shielded and away from those sources unless the goal is to monitor the disturbance itself.
Ignoring crop-canopy height
A fixed sensor above a young crop may end up inside or below dense foliage later. As biomass changes, so do airflow and humidity. Sensor height should be part of the seasonal maintenance plan.
Treating manufacturer radio range as a site guarantee
Published ranges are usually line-of-sight. Conduct a radio survey with doors, screens, wet plants, and equipment in normal operating positions. Gateways should be located for both RF coverage and reliable backhaul.
Adding sensors without a decision model
More sensors do not automatically improve control. Every permanent sensor should have a reason: represent a control zone, identify a known gradient, verify an agronomic variable, provide redundancy, or support troubleshooting. Otherwise it creates maintenance and data-review cost without improving decisions.
Failing to review drift and calibration conditions
Greenhouses expose sensors to high humidity, dust, sprays, condensation, and temperature cycling. Accuracy claims are conditional, and drift can increase outside laboratory conditions. Periodic comparison, cleaning, and calibration checks should be planned from the start.
Frequently Asked Questions
How many temperature and humidity sensors do I need in a greenhouse?
There is no universal sensor-per-area rule in the sources reviewed. A practical starting point is one representative T/RH node per independent climate-control zone, followed by temporary mapping to determine whether additional points are needed. Large or heterogeneous greenhouses often require more than one point because solar load, airflow, heating, cooling, crop density, and irrigation can create repeatable microclimates.
Where should greenhouse temperature and humidity sensors be placed?
Place them where they represent the crop environment, typically around the active canopy, with protection from direct solar radiation and away from local heater, fan, vent, pad, or door effects unless those effects are intentionally being measured. Revisit the height as the crop grows.
Should greenhouse sensors be evenly spaced?
Not necessarily. Equal spacing is simple but can waste sensors in uniform areas and miss important gradients. A better method is to map the greenhouse, identify zones that behave differently, and keep permanent sensors where they represent those zones or known extremes.
Do I need a CO2 sensor in every greenhouse zone?
Only when CO2 is an important control variable and concentration can differ by zone. Separate dosing, ventilation, long distances, or poor air mixing can justify multiple CO2 points. Place the sensor to represent crop exposure rather than directly beside the injection outlet.
Is LoRa better than Wi-Fi for greenhouse sensors?
LoRa is often easier to scale when many low-power nodes must cover a large greenhouse or multiple bays, because the nodes do not each need direct Wi-Fi access. Wi-Fi can be simpler where coverage and power are already strong. The best design may combine LoRa for local sensing with Ethernet, Wi-Fi, or 4G at the gateway.
How often should greenhouse sensors log data?
The interval should be shorter than the environmental process you need to observe. Rapid vent, heater, irrigation, or CO2 cycles may require minute-level data, while long-term agronomic trends may tolerate longer intervals. Faster logging increases power and storage requirements, so choose it based on control and analysis needs.
How can I tell whether I have too few sensors?
Compare multiple temporary nodes across representative operating conditions. If locations within the same supposed zone repeatedly diverge enough to change irrigation, ventilation, heating, CO2, or crop-risk decisions, the zone is under-instrumented or poorly defined.
Conclusion
How many sensors does a greenhouse really need? The answer is the number required to represent its meaningful microclimates and control decisions – not a fixed sensor count based on floor area alone. Published greenhouse research repeatedly shows that location selection can be optimized and that a smaller, well-chosen network can represent a much denser temporary grid in a specific facility. [1][2][3]
For most projects, temperature and humidity provide the baseline zoning signal. Add CO2 where enrichment is controlled, PAR where lighting or shading changes by zone, and soil/substrate or plant sensors where irrigation and crop-response decisions require them. Use temporary mapping to validate the permanent design, and treat radio coverage, local storage, calibration, sensor shielding, and platform integration as part of the measurement system rather than afterthoughts.
A gateway-centered LoRa architecture such as UbiBot GW1/GW1-O with GS1-L, WS1 Pro-L, and dedicated LoRa/RS485 sensing nodes is one way to scale this model across multiple greenhouse zones while retaining local data storage, cloud management, APIs, and optional on-premises deployment. The same zoning principles still apply regardless of brand: the system is only as useful as the locations and parameters it represents.
Source and Specification Note
This article uses current official manufacturer pages and datasheets where available, plus published greenhouse sensor-placement research. Product specifications can change. Line-of-sight radio ranges are not guaranteed greenhouse ranges. Accuracy figures are quoted only with the conditions stated in the reviewed official documentation. Where current official public materials did not state a specification, the article says so instead of inferring it. Sencrop’s current Thermocrop 4G materials were used for architecture and deployment; the older 2023 Thermocrop datasheet is explicitly identified where legacy accuracy values are mentioned.
References
[1] Uyeh DD et al. “A genetic programming-based optimal sensor placement for greenhouse monitoring and control.” Frontiers in Plant Science, 2023. https://www.frontiersin.org/journals/plant-science/articles/10.3389/fpls.2023.1152036/full
[2] Xue W et al. “Data-driven sensor placement for greenhouse microclimate measurement: A POD-Greedy reduced-basis approach.” Measurement, 2026. https://www.sciencedirect.com/science/article/pii/S0263224126022025
[3] Lee et al. “Optimal sensor placement for monitoring and controlling greenhouse internal environments.” Biosystems Engineering, 2019. https://www.sciencedirect.com/science/article/pii/S1537511019308487
[4] UbiBot GS1-L Specifications. https://www.ubibot.com/ubibot-gs1l-specifications/
[5] UbiBot WS1 Pro-L Specifications. https://www.ubibot.com/ubibot-ws1prol-specifications/
[6] UbiBot GW1 Specifications. https://www.ubibot.com/ubibot-gw1-specifications/
[7] UbiBot GW1-O Specifications. https://www.ubibot.com/ubibot-gw1o-specifications/
[8] UbiBot DC1-L-TH Specifications. https://www.ubibot.com/ubibot-dc1lth-specifications/
[9] UbiBot DC1-L-CO2 Specifications. https://www.ubibot.com/ubibot-dc1lco2-specifications/
[10] UbiBot Platform API / On-Premises Platform documentation. https://www.ubibot.com/category/platform-api/ ; https://www.ubibot.com/on-premises-platform/