
UBiBot Logo
UBiBot Logo
  • UBiBot Logo
  • Home
  • Products

    NEW

  • Pricing
  • Support
  • About Us
  • Download
  • magnifying-glass  Search
  • magnifying-glass header-close
  • Sign in Sign in
    Public Web Console Public Web Console
    On-Premises App Center On-Premises App Center
  • Home
  • Products

    NEW

  • Pricing
  • Support
  • About us
  • Download
  •  Public Web Console
  •  On-Premises App Center
  • Where to Buy

Learn Hub

Explore Knowledge Academic Research In-depth Tech

Share

LinkedIn

Facebook

X (Twitter)

Newsletter Signup

Table of contents

    How to Build a Greenhouse Environmental Monitoring System?

    Published: September 14, 2026

    Update: September 14, 2026

    By Susan Jones

    A greenhouse can meet its central thermostat setting while crops near a cooling pad, sidewall, or shaded bench experience different conditions. That variation makes irrigation decisions harder, obscures the cause of uneven growth, and can leave overnight equipment failures unnoticed until the next inspection. Adding sensors helps only when their locations and measurements answer the grower’s operational questions.

    This guide explains how commercial growers and controlled environment agriculture teams can design a greenhouse environmental monitoring system around crop zones, root conditions, communications, and response procedures. It compares UbiBot GS1-L-A1RS with GW1 or GW1-O, Aranet PRO Plus, HOBO RX3000, and Davis EnviroMonitor IP Gateway 6805. The goal is to select a workable measurement network before committing to a platform or a large hardware order.
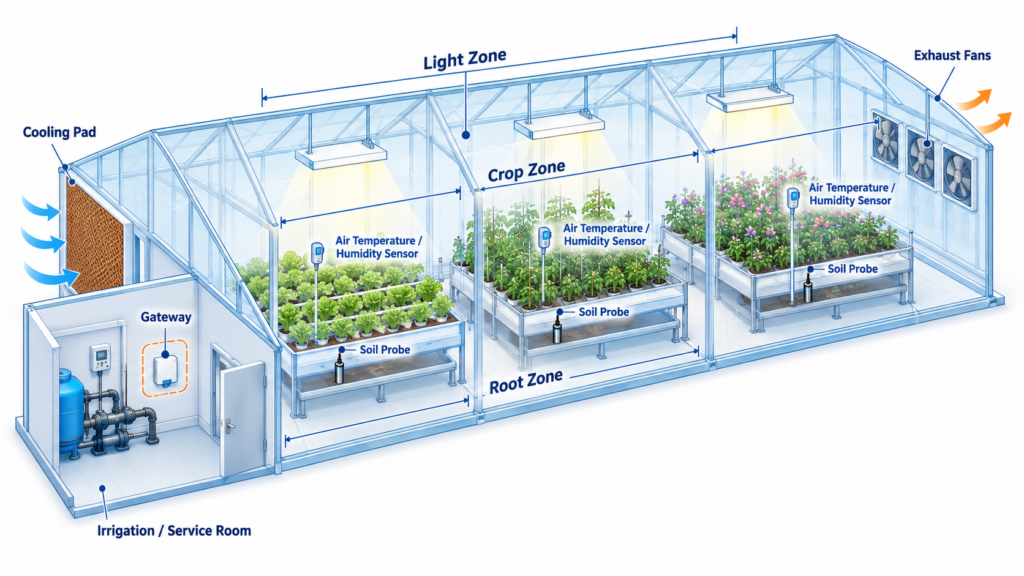
    Isometric greenhouse cutaway showing canopy sensors, root-zone probes, lighting zones, cooling pad, exhaust fans, and a protected gateway.

    A greenhouse monitoring plan separates crop, irrigation, lighting, and equipment zones so each measurement supports a defined decision.

    Quick Summary

    Monitor air temperature and relative humidity in representative crop zones, then add root-zone moisture and temperature, photosynthetic light, and CO₂ according to the production system. Use PAR measurements for crop-light decisions; lux alone does not establish daily light integral. A complete system combines suitable probes, local recording, a greenhouse sensor network, a gateway or station, a data platform, and tested alarms. Ethernet is useful for fixed backhaul, Wi-Fi for covered locations, cellular for remote sites, and compatible sub-GHz wireless systems for distributed sensors. RS485 can connect industrial probes when protocol and power requirements match. Compare complete installed systems, including calibration, software, ongoing service, and outage behavior. Pilot the network under real crop and irrigation conditions, then expand by independently managed zones rather than floor area alone.

    Key Takeaway

    Build the system around decisions at crop level: where conditions differ, which measurement changes an action, and who responds when a limit is crossed. UbiBot can suit expandable LoRa and RS485 monitoring, while Aranet, HOBO, and Davis offer distinct horticultural, research, and agricultural workflows. Verify probe compatibility and outage recovery before choosing among them.

    Why Is Environmental Monitoring Important in a Greenhouse?

    Commercial greenhouses contain several interacting environments. Air above a bench can differ from air within a dense canopy, while substrates supplied by the same irrigation line may dry at different rates. A grower needs enough spatial information to distinguish a local problem from a facility-wide event. A single averaged reading can conceal that distinction.

    Continuous records support crop protection and operational continuity by showing when conditions departed from the intended recipe. They also help investigate recurring differences between bays, relate irrigation events to root-zone response, and assess whether a ventilation change improved conditions. These are management benefits, not guarantees of higher yield or lower energy use.

    Humidity deserves particular attention because moisture accumulation and condensation affect greenhouse disease management. UMass Extension discusses coordinated watering, air movement, heating, and ventilation as ways to reduce humidity problems. Monitoring helps evaluate those practices; it does not diagnose pathogens or replace crop inspection. [1]

    Traceability requires context as well as measurements. Keep sensor identity, location, crop stage, maintenance, and setpoint changes alongside the time series. These records can support internal quality procedures and customer documentation. The monitoring products compared here are not presented as automatically satisfying any food-safety, occupational-safety, or regulated-crop requirement. Manual checks remain useful for verification, but cannot reconstruct every overnight excursion.

    What Environmental Parameters Should Be Monitored?
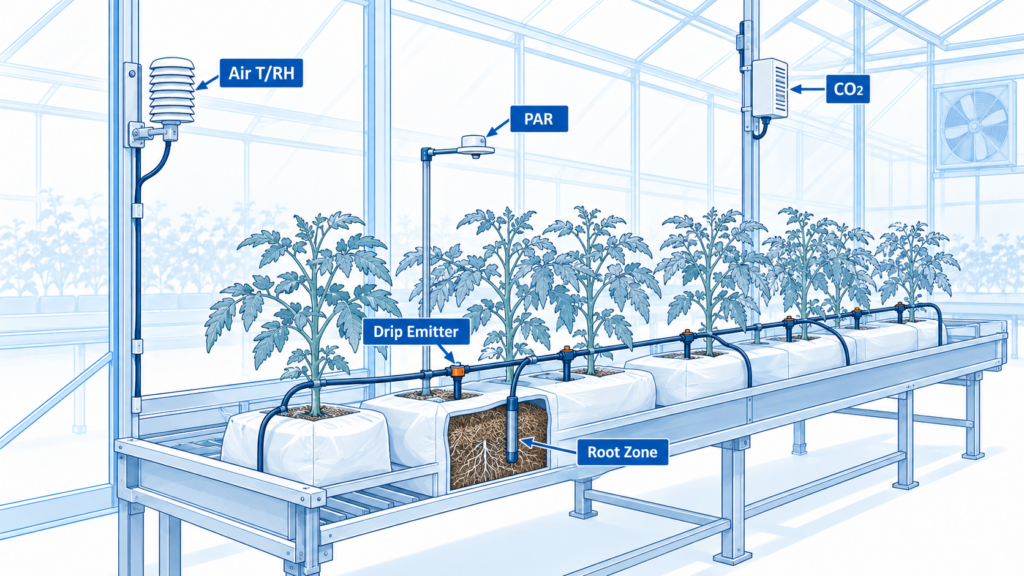
    Crop cross-section with shielded air sensor at canopy height, level PAR sensor above the canopy, and moisture probe at representative root depth.

    Air, light, and root-zone probes need different positions to measure the environment that affects the crop.

    Start with air temperature and relative humidity across independently managed crop zones. Add root-zone measurements wherever irrigation decisions depend on substrate behavior. CO₂ becomes a priority in enriched houses or when diagnosing daytime depletion. Photosynthetic light measurements are essential when the operation manages supplemental lighting, shading, or crop-specific daily light targets.

    Parameter Why it matters Monitoring location Recommended sensor type
    Essential baseline: air temperature and RH Identifies heat, cold, and moisture differences Representative canopy height in each climate zone Shielded T/RH probe suitable for the exposure
    Essential for irrigation management: substrate moisture and temperature Shows drying and root-zone differences Representative root depth in each substrate and irrigation zone Media-appropriate dielectric moisture and temperature probe
    Essential for light management: PPFD and DLI Measures crop-relevant light and daily accumulation Level, at crop height in representative lighting zones Calibrated PAR quantum sensor plus time integration
    Essential for enrichment: CO₂ Checks distribution and depletion Representative canopy air, away from direct injection CO₂ sensor with a suitable range and calibration method
    Optional: substrate EC and nutrient-solution pH Supports fertigation investigation Root zone, feed solution, or drain according to the question Probe explicitly designed for the chosen medium
    Optional: leaf temperature and wetness Adds plant-surface and moisture context Representative leaves or crop-like exposed surface IR temperature sensor or leaf-wetness sensor
    Optional: outdoor weather, flow, tank level, and equipment status Explains outside influences and utility failures Outside reference site and irrigation equipment Weather instruments, flow/level sensors, or supported status inputs

    Selection implication: prioritize measurements that change an irrigation, climate, lighting, or response decision. A longer parameter list does not automatically improve management.

    Relative humidity depends on temperature. Vapor-pressure deficit, or VPD, combines moisture and temperature information and can be more useful for interpreting evaporative demand. Air VPD calculated from air temperature and RH should be identified as such; leaf-to-air VPD needs leaf-temperature information. Michigan State University Extension explains why growers should consider VPD alongside RH. [2]

    Light units also matter. Lux describes illuminance weighted for human vision. Photosynthetic photon flux density, or PPFD, measures photon flux in the sensor’s specified photosynthetic waveband, commonly expressed as µmol m⁻² s⁻¹. Daily light integral, or DLI, accumulates that exposure in mol m⁻² d⁻¹. Purdue Extension recommends quantum sensors at plant height and emphasizes crop-specific DLI requirements. A fixed lux conversion is unsuitable across changing sunlight and LED spectra. [3]

    Moisture values require equal care. Mineral soil, peat, coir, and rockwool can need different calibration relationships. Record installation depth and position relative to the emitter. Do not interpret bulk substrate EC, pore-water EC, and feed-solution EC as interchangeable readings, or treat soil moisture percentage and soil-water tension as the same variable.

    What Does a Typical Environmental Monitoring System Include?

    The sensing layer measures the actual crop environment. A local node reads probes, applies the supported acquisition settings, and may retain records. The connectivity layer carries readings through compatible radio or wired links. A gateway or logging station provides the connection to a local network, the internet, or both.

    The platform organizes histories and users. An alarm and integration layer then delivers exceptions to people or another system. Specify who maintains each layer and where data remains available when a link fails. Cloud access reduces local server administration; an on-premises deployment adds responsibility for backups, security updates, and recovery.

    Architecture flow: Crop-zone probes → local sensing nodes → compatible wireless network → gateway → Ethernet, Wi-Fi, or cellular backhaul → cloud or on-premises platform → alarms, reports, and approved integrations.
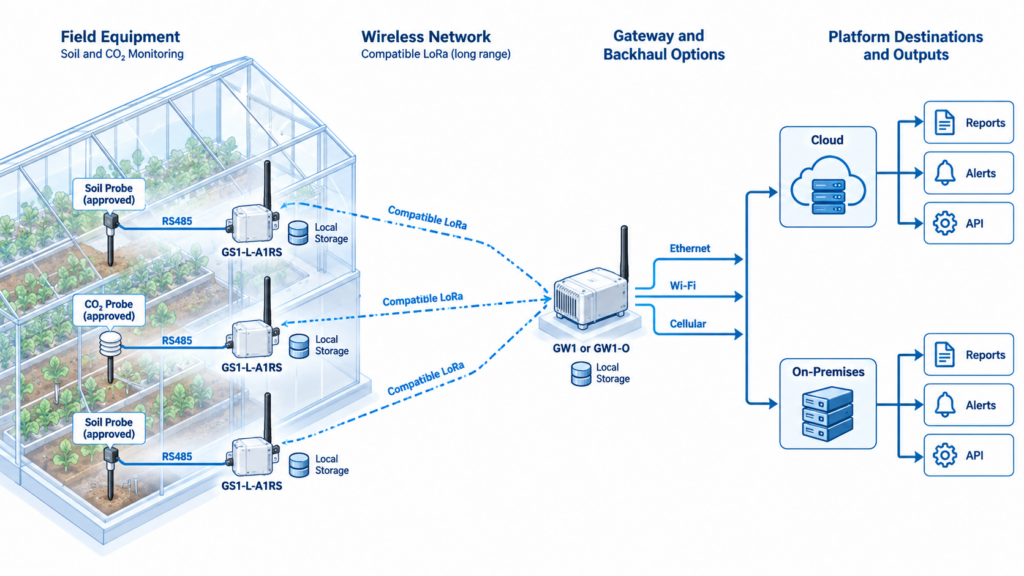
    Architecture showing approved RS485 probes linked to GS1-L nodes, a compatible LoRa gateway, network backhaul, and alternative cloud or on-premises platforms.

     Local probe links, the wireless sensor network, gateway backhaul, and the data platform form separate parts of the monitoring path.

    For the proposed UbiBot arrangement, connect approved RS485 probes to GS1-L-A1RS nodes, then use matching regional LoRa versions with GW1 or GW1-O. On-premises access and APIs are documented platform offerings, but the exact firmware, licensing, and forwarding route should be confirmed for the ordered configuration. [4] [5] [6] [7] [8] [9]

    Keep automatic climate control within an engineered control system. Monitoring can supply evidence and integration inputs, but control requires suitable actuators, interlocks, failure states, and response timing. A cloud dashboard alone is not a greenhouse climate computer.

    Which Communication Method Should Be Used?

    Choose communications separately for the probe connection, sensor network, and internet backhaul. A LoRa node can collect an RS485 probe while its gateway uses Ethernet. Calling the whole system simply “wireless” hides these different dependencies.

    Method Suitable use Main advantage Design limitation
    Wi-Fi Covered houses and nearby service rooms Uses an existing IP network Survey coverage with mature crops, screens, and wet surfaces
    Ethernet Fixed gateway or station backhaul Predictable wired connection Requires protected cabling and powered network equipment
    4G or cellular Remote houses or independent backhaul Avoids reliance on farm broadband Check carrier, region, antenna, power, and recurring service
    LoRa or another compatible sub-GHz system Distributed low-data-rate crop sensors Reduces long sensor cable runs Match vendor protocol and regional radio version; test coverage
    RS485 Nearby industrial probes and equipment Practical wired probe interface Requires compatible protocol, addressing, electrical interface, and power

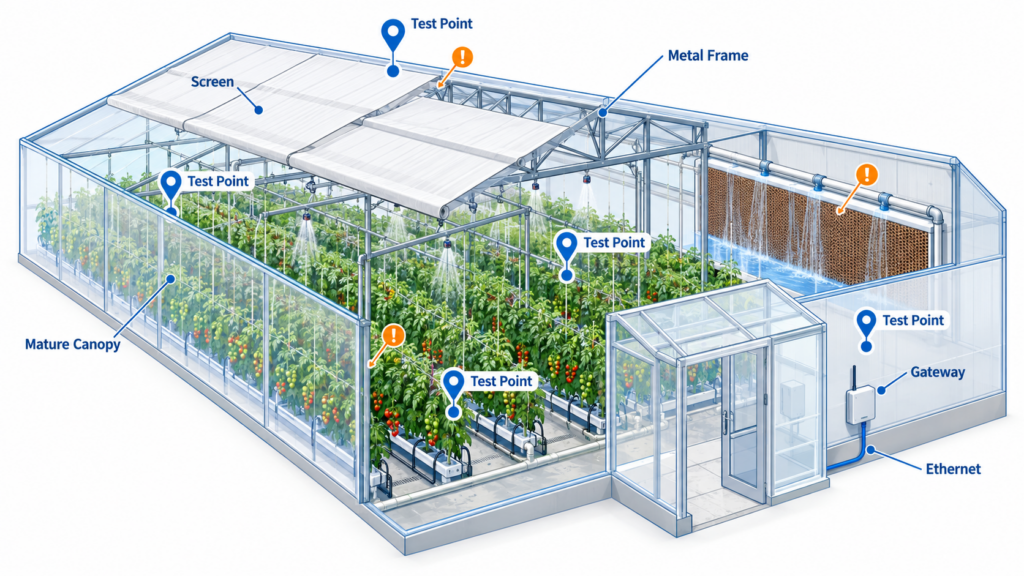
    Greenhouse plan showing survey points around mature crops, closed screens, metal structures, and a gateway with Ethernet backhaul.

     Test radio coverage with the crop, screens, and irrigation in their operating conditions before fixing gateway locations.

    Selection implication: use a mixed network when it simplifies installation. For dispersed bays with available broadband, compatible sub-GHz sensors plus an Ethernet gateway are often a sensible design starting point. Remote sites may justify cellular backhaul.

    LoRa describes radio technology; LoRaWAN defines a network protocol. UbiBot’s cited GS1-L and gateway specifications identify LoRa, not general compatibility with arbitrary LoRaWAN gateways. Similarly, Aranet uses its own sub-GHz system and Davis uses an EnviroMonitor mesh. Similar operating frequencies do not establish interoperability. [4] [5] [6]

    For US projects, order the supported US radio version. For international deployment, match both node and gateway to the destination and verify the permitted configuration. UbiBot lists several regional bands; Aranet and Davis also publish regional variants. Global frequency availability is therefore a purchasing consideration, not an exclusive UbiBot advantage. Avoid treating advertised open-air range as a greenhouse coverage guarantee.

    How Should Monitoring Products Be Compared?

    Accuracy matters only alongside measurement location, response time, exposure limits, and maintenance. An accurate sensor mounted on a sunlit frame may describe the frame’s thermal environment better than the crop’s. Compare accuracy over the actual operating range and distinguish typical performance from maximum error.

    Ask vendors to explain three failure cases separately: the node loses radio contact, the gateway loses internet access, and the site loses power. Local storage capacity does not prove that every lost radio packet can be recovered. Request an acceptance test showing which records survive, how original timestamps are preserved, and what appears on the dashboard during a stale-data condition.

    Compare the entire bill of materials: probes, shields, nodes, gateways, mounts, power supplies, installation, calibration, software, alerts, integrations, and replacement parts. Ask whether data remains exportable after a subscription ends. Also test user permissions and multi-site navigation with realistic staff roles. These details can outweigh a small difference in sensor price.

    Product and Solution Comparison

    The tables compare defined system components, not equivalent ready-made kits. “Not publicly specified” means the reviewed official material did not establish the requested detail for the selected configuration; it does not prove that the feature is unavailable. Accuracy belongs to the identified probe, not the gateway. Deployment complexity below is a design judgment; a relative cost ranking requires matched project quotes.

    Hardware and measurement comparison

    System Positioning and measured parameters Verified accuracy example Gateway and external sensors
    UbiBot GS1-L-A1RS + GW1-24FETH or GW1-24FETH-O Distributed LoRa monitoring; built-in T/RH and lux; approved external soil, CO₂, and other probes Built-in T: ±0.2°C at 0–60°C; RH: ±2% RH at 10–90% RH Dedicated compatible gateway; RS485 interface; UB-CO₂-P1 example; exact soil/PAR configuration requires confirmation. [4] [5] [6] [7]
    Aranet PRO Plus TDSBOAU3 + Aranet PRO sensors Horticultural wireless monitoring; T/RH, CO₂, PAR, plant temperature, and root-zone options TDSPC0U5 CO₂: ±(30 ppm + 3% of reading), at 0–5,000 ppm, 15–35°C, 0–80% RH Dedicated PRO Plus; separate T/RH and horticultural probes, including WET150 and PAR options.
    HOBO RX3000 RX3001-00-01 + S-THB-M002 Research-oriented station; selected smart sensors and optional analog inputs T: ±0.21°C at 0–50°C; RH: ±2.5% typical, ±3.5% maximum at 10–90% RH and 25°C, including hysteresis RX3000 is the station; optional RXMOD-A1 analog module and RXW Manager for HOBOnet expansion.
    Davis EnviroMonitor IP Gateway 6805 + Node 6810 Agricultural mesh; selected T/RH, moisture, CO₂, PAR, weather, and irrigation sensors Project probe set: Not publicly specified; select exact sensor SKUs before comparing accuracy Dedicated 6805; up to four sensors per 6810; published compatibility list includes Davis and third-party probes.

    Selection implication: Aranet and Davis offer agricultural sensor ecosystems, while HOBO supports a station-based measurement workflow. UbiBot merits evaluation where approved RS485 probes and distributed LoRa nodes meet the project’s requirements.

    The GS1-L datasheet lists an operating humidity of 10–90% RH, non-condensing, even though its built-in humidity measurement range extends further. Keep the node within its operating specification and use appropriately exposed probes. The UB-CO₂-P1 manual gives a nominal 400–10,000 ppm measurement range and a stated accuracy expression of ±(30 ppm + 3%); confirm the percentage basis and ordered revision before making direct accuracy comparisons. [4] [7]

    Connectivity and data continuity comparison

    System Network and expansion Local storage Offline data protection
    UbiBot GW1-24FETH: Ethernet/Wi-Fi; GW1-24F4G adds 4G. Outdoor GW1-24FETH-O: Ethernet/Wi-Fi; GW1-24F4G-O: Ethernet/mobile network GS1-L: 50,000 sensing records; cited GW1/GW1-O variants: 300,000 records Storage documented; exact node-to-gateway replay and full outage recovery behavior: Not publicly specified in reviewed specifications. [4] [5] [6]
    Aranet PRO Plus Ethernet/Wi-Fi; 12 sensors initially, licensed expansion to 50 or 100 Base station specification: ten years for 100 sensors Local base storage and web access; sensor-side replay after radio loss: Not publicly specified for the proposed probe set.
    HOBO RX3001 Ethernet; RX3002-00-01 Wi-Fi and RX3004-00-01 4G are separate variants RX3000: 32 MB, two million measurements Continuous station logging overwrites oldest records when full; verify recovery with the selected wired or HOBOnet configuration.
    Davis 6805 Ethernet/Wi-Fi backhaul; mesh supports up to 32 Nodes Exact capacity: Not publicly specified in reviewed documents With backup batteries, 6805 stores received records during AC loss and uploads after AC returns; uploads stop on backup operation.

    Selection implication: offline recording and live alarm delivery are separate requirements. Document the surviving measurement path and power supply for each expected outage.

    Platform and ownership comparison

    System Platform and integrations Alarms and calibration Subscription and project implications
    UbiBot Public cloud; on-premises offering; platform API and HTTP alert interaction. Confirm forwarding and multi-site permissions by edition App, email, SMS, voice, and HTTP options at platform level; charges vary. Calibration certificate scope for the selected probes: Not publicly specified Public/on-premises plans and optional services. Moderate-complexity baseline; relative total cost category: Not publicly specified without a matched quote. [8] [9] [10]
    Aranet Local web interface and Aranet Cloud; MQTT, Modbus TCP/IP, BACnet IP require integration licenses Email documented; do not assign LTE-model SMS to standard PRO Plus. CO₂ sensor has factory, manual, and automatic calibration provisions Sensor-capacity and integration licenses; obtain cloud quote. Moderate complexity; relative total cost category: Not publicly specified.
    HOBO HOBOlink cloud; REST web services with OAuth. Self-hosted HOBOlink: Not publicly specified Text/email documented; probe-specific calibration and certificate scope must be selected Paid data plan; station, probes, power, and optional modules. Moderate to higher complexity with expansion; relative total cost category: Not publicly specified.
    Davis WeatherLink/Mobilize; WeatherLink v2 API. Self-hosted WeatherLink: Not publicly specified Agricultural alarms documented; complete delivery-channel and calibration-certificate scope: Not publicly specified for the proposed package Activation and annual gateway service required. Moderate mesh installation; relative total cost category: Not publicly specified.

    Selection implication: ask for a comparable three-year quote covering the same zones and measurements. Public Davis pages show differing fees for some service intervals, so obtain current written pricing instead of carrying a single published amount into a budget. An on-premises UbiBot installation adds server ownership costs; it is not automatically the lowest-cost choice.

    Which System Is Best for Each Use Case?

    UbiBot is a reasonable candidate for growers seeking distributed monitoring with approved industrial probes and a choice of platform deployment. Its potential benefit is combining crop and facility measurements without extending Wi-Fi to every node. Whether it reduces total cost depends on compatibility work, gateway coverage, probe power, software, and the team’s support capability.

    Aranet deserves consideration when specialized horticultural measurements and a local base-station interface matter. Its published greenhouse portfolio includes plant temperature, PAR, substrate measurements, and irrigation-related instruments. HOBO RX3000 is attractive for research plots or stations that require documented logging behavior, smart sensors, and analog expansion. Davis is well suited to evaluating greenhouse conditions alongside agricultural weather and irrigation data.

    For tightly coupled climate, fertigation, and enrichment control, assess a professional greenhouse automation system and use monitoring as an independent or integrated measurement layer. Where a formal quality or compliance program applies, compare validation services, calibration documentation, access controls, and contractual support separately from basic sensor features.

    How to Build a Greenhouse Environmental Monitoring System
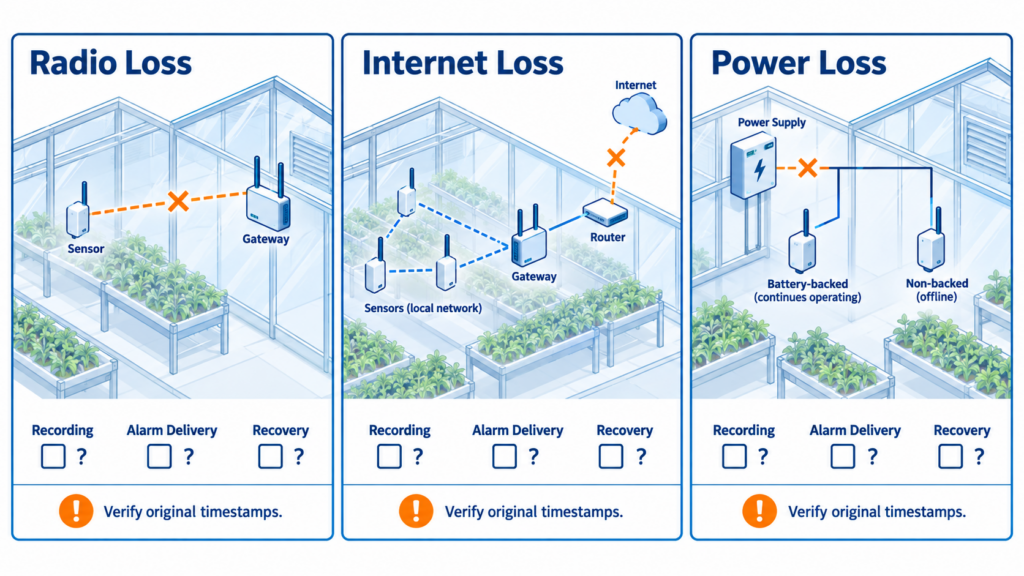
    Three test panels separating sensor-radio failure, gateway internet failure, and power failure, with checks for logging, alarms, and recovered timestamps.

    Test sensor-radio loss, internet loss, and power loss separately, then verify records and alarm behavior after recovery.

    Start with a small facility pilot

    Draw the crop zones, irrigation circuits, cooling pads, fans, vents, doors, and service room. For a single house, an illustrative starting survey might use three air-monitoring locations near the inlet zone, center crop zone, and far end, plus root-zone probes representing distinct irrigation or substrate conditions. This is a pilot example, not a universal minimum.

    Locate air probes at representative canopy height with appropriate radiation protection. Keep them away from direct mist, heater discharge, and structural contact unless measuring that influence deliberately. Test the network through daytime ventilation and overnight conditions. Use a supported logging interval that captures the events of interest; select the upload interval separately to meet the response requirement.

    Expand across a medium facility

    Treat each independently controlled compartment as a separate monitoring unit. Add points where crop height, lighting, exposure, or irrigation creates persistent differences. Move temporary survey sensors to resolve uncertainty before making them permanent. Replicate root-zone locations where a single container would give an unreliable picture of the irrigation zone.
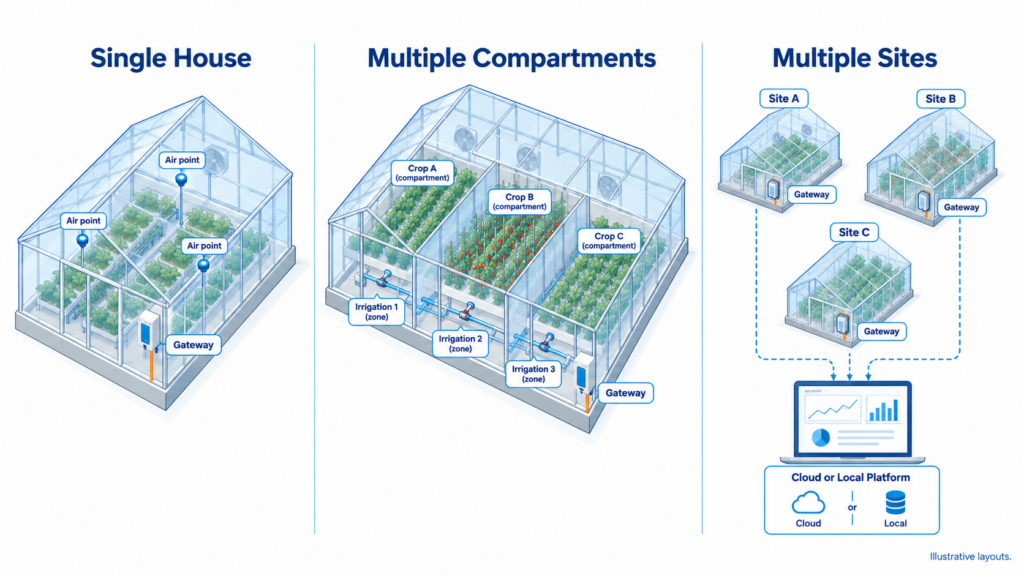
    Small, medium, and multi-site greenhouse monitoring layouts with distinct crop zones and shared reporting.

    Add monitoring points as independently managed zones and meaningful environmental differences increase.

    System Platform and integrations Alarms and calibration Subscription and project implications
    UbiBot Public cloud; on-premises offering; platform API and HTTP alert interaction. Confirm forwarding and multi-site permissions by edition App, email, SMS, voice, and HTTP options at platform level; charges vary. Calibration certificate scope for the selected probes: Not publicly specified Public/on-premises plans and optional services. Moderate-complexity baseline; relative total cost category: Not publicly specified without a matched quote. [8] [9] [10]
    Aranet Local web interface and Aranet Cloud; MQTT, Modbus TCP/IP, BACnet IP require integration licenses Email documented; do not assign LTE-model SMS to standard PRO Plus. CO₂ sensor has factory, manual, and automatic calibration provisions Sensor-capacity and integration licenses; obtain cloud quote. Moderate complexity; relative total cost category: Not publicly specified.
    HOBO HOBOlink cloud; REST web services with OAuth. Self-hosted HOBOlink: Not publicly specified Text/email documented; probe-specific calibration and certificate scope must be selected Paid data plan; station, probes, power, and optional modules. Moderate to higher complexity with expansion; relative total cost category: Not publicly specified.
    Davis WeatherLink/Mobilize; WeatherLink v2 API. Self-hosted WeatherLink: Not publicly specified Agricultural alarms documented; complete delivery-channel and calibration-certificate scope: Not publicly specified for the proposed package Activation and annual gateway service required. Moderate mesh installation; relative total cost category: Not publicly specified.

    Selection implication: allocate sensors by functional differences and actionability, then remove duplication only when survey data supports it.

    Standardize a large or multi-site installation

    Use consistent identifiers such as US-Farm01-House03-ZoneB-Air01. Retain sensor serial numbers, model, calibration status, mounting height, and crop assignment. Separate viewing permissions from authority to change alarms or delete records. Keep timestamps consistent and display each site’s local time clearly.

    Commission an alarm by creating a safe test condition, measuring receipt time, and confirming acknowledgment by the assigned person. Include stale data and loss of power where supported. Test internet loss, gateway restart, and representative sensor disconnection separately; compare exported timestamps after recovery. Repeat affected checks when firmware, probe type, or network configuration changes.

    Common Design and Installation Mistakes

    1. Mounting an air probe on a sunlit greenhouse frame. Separate the sensing element from conductive surfaces and use appropriate shielding.
    2. Leaving the sensor at seedling height after the canopy grows. Review locations as crop structure changes.
    3. Calling a lux trace a DLI record. Use the correct quantum sensor and documented integration method.
    4. Placing the only CO₂ probe beside the injection outlet. Measure representative crop air and investigate distribution with additional points.
    5. Using one moisture probe for different substrates or irrigation zones. Validate placement, media response, and repeatability.
    6. Testing radio coverage only in an empty, dry house. Repeat under mature canopy, operating screens, and normal irrigation conditions.
    7. Assuming backup storage guarantees an overnight alarm. Test the power and communication path all the way to the responsible person.

    Frequently Asked Questions

    How many sensors does a commercial greenhouse need?

    The number depends on independently managed climate and irrigation zones, crop structure, and measured variability. Start with a survey that compares representative crop locations and suspected problem areas, then retain enough points to distinguish actionable differences. A sensor at each end and one in the center can be an initial air survey in a simple house, but it is not a design standard. Root-zone probes should represent the substrates and irrigation groups that require separate decisions.

    Where should temperature and humidity sensors be placed?

    Place them at representative crop-canopy height, with suitable radiation protection and airflow. Avoid direct heater discharge, mist, cooling-pad spray, and contact with structural metal unless the purpose is to investigate that particular influence. Record the height and location so that comparisons remain meaningful. As crops grow or benches move, check whether each point still represents the intended environment. Use additional temporary measurements to investigate gradients before relocating the permanent reference point.

    Can a greenhouse monitoring system work without Wi-Fi?

    Yes. Sensor nodes can use a compatible sub-GHz network, while the gateway connects through Ethernet or an appropriate cellular variant. Some systems also provide local storage or a local interface. However, operating without Wi-Fi is different from operating without internet, and both differ from surviving a power outage. Define which readings, alarms, and user interfaces must remain available in each condition, then demonstrate that behavior with the proposed hardware and software.

    Is LoRa the same as LoRaWAN for greenhouse sensors?

    No. LoRa is a radio technology, while LoRaWAN defines how a particular network operates above that radio layer. A product described as LoRa does not automatically connect to any LoRaWAN gateway. The UbiBot models reviewed here are specified as LoRa devices and should be paired with confirmed compatible gateways. Check region, protocol, firmware, and sensor support together. The same frequency label on products from two manufacturers is not evidence that they can exchange usable measurements.

    Do I need CO₂ monitoring if I do not add CO₂?

    It can still be useful when investigating ventilation or possible daytime depletion, but its priority depends on the crop, enclosure, and management question. Begin with representative canopy measurements and interpret them alongside light and ventilation activity. If enrichment is introduced, review range, calibration, placement, and distribution again. A crop-management CO₂ sensor should not be assumed to provide the separately engineered detection, interlocks, or response arrangements needed for a personnel-safety function.

    Can a lux sensor measure the light plants need?

    A lux sensor can show relative changes in illuminance, but it does not directly measure photosynthetic photon flux. For crop-light planning, specify a suitable PAR quantum sensor and integrate its readings over time to calculate DLI. The relationship between lux and PPFD changes with the light spectrum, which makes a universal conversion unreliable across sunlight and different LEDs. Keep the sensor level at crop height and follow its cleaning and calibration instructions. [3]

    Will data be lost when the internet connection fails?

    That depends on where records are stored, which equipment remains powered, and how recovery works. A station may retain data during internet loss while a disconnected wireless probe has no recoverable history. Storage also fills, and some devices overwrite older records. Test internet loss and sensor-radio loss separately. After reconnecting, compare original measurement timestamps, missing intervals, duplicates, and the time required for backfill. Confirm whether alarms during the outage are delayed, reconstructed, or unavailable.

    Can third-party soil and CO₂ probes be connected through RS485?

    Possibly, but RS485 alone does not establish compatibility. Confirm the protocol, register map, baud rate, addressing, voltage, current demand, connector wiring, and supported firmware. Check whether the node reads every required field and assigns the correct units and scaling. For GS1-L-A1RS, obtain approval for the exact probe combination and cable arrangement before purchase. Bench-test it through startup, normal sampling, and power cycling before deploying it in wet production areas.

    What should be included in the system budget?

    Include complete measurement points, shields, mounts, nodes, gateways, network equipment, backup power, installation, and commissioning. Add calibration, probe replacement, batteries, cellular service, platform subscriptions, alert usage, and integration maintenance over a common ownership period. If comparing an on-premises system, include server administration and backups. Ask vendors to quote the same number of zones and the same measurements. A low gateway price says little about the final cost of a working, maintainable installation.

    Conclusion and Selection Recommendations

    Begin with the crop and the decisions that require better evidence. Map environmental differences, select suitable probes, and verify communications and outage behavior in a pilot. Expand only after the data and alarm workflow prove useful to the people managing production.

    UbiBot GS1-L-A1RS with a suitable GW1 or GW1-O can provide a balanced monitoring option when approved probe expansion, distributed wireless coverage, and platform flexibility match the project. Aranet, HOBO, and Davis remain credible choices for their respective horticultural, research, and agricultural workflows. Request a matched configuration and acceptance test from each shortlisted supplier. For automatic control or formal validation requirements, evaluate the necessary specialist system and services alongside the monitoring network.

    Sources and Product Information Disclaimer

    Specifications and services vary by model, region, probe, firmware, software edition, and subscription. Sources below were reviewed on September 14, 2026; older official manuals are identified by document title or revision where available. Confirm the current orderable configuration and regional availability before procurement. Recommendations are engineering judgments for planning, not tested comparative performance claims. No system-level regulatory certification, yield improvement, or cost saving is implied.

    Official Sources

    These sources support the article and all three product comparison tables. Each numbered reference in the article links directly to its official source. Review date September 14, 2026.

    1  UMass Extension — Reducing Humidity in the Greenhouse

    Humidity management guidance; search-indexed official text reviewed.

    2  Michigan State University Extension — Why greenhouse growers should consider vapor-pressure deficit

    VPD guidance; official search result and extension publication identified.

    3  Purdue Extension — Measuring Daily Light Integral HO 238 B W

    DLI, crop dependence, quantum sensor placement and care.

    4  UbiBot — GS1-L specifications

    GS1-L-A1RS accuracy, memory, operating conditions, bands, and external probe categories.

    5  UbiBot — GW1 specifications

    GW1-24FETH and GW1-24F4G backhaul, power, memory, and regional bands.

    6  UbiBot — GW1-O specifications

    GW1-24FETH-O and GW1-24F4G-O interfaces, IP65 rating, and memory; interfaces differ by model.

    7  UbiBot — UB-CO₂ user guide version 1.3

    UB-CO₂-P1/P2/P3 measurement specifications, RS485 Modbus RTU, and power requirements.

    8  UbiBot — Pricing Overview and On-Premises App Center

    Public platform, on-premises platform, and developer offerings. Detailed on-premises plans: Open official page

    9  UbiBot — Platform API Quick Start and Limits

    API availability and limits; exact project entitlements require confirmation.

    10  UbiBot — Alerts

    Platform notification channels, HTTP interaction, and paid message options; not proof of offline local alarm behavior.


    Related Resources

    What Is an Environmental Monitoring System and How Does It Work?
    UbiBot vs Eupry vs Dickson vs ELPRO: Which Remote Temperature Monitoring System Fits Your Site?
    How to Build a Multi-Site Environmental Monitoring System: Sensors, Gateways, Audit Trails and Total Cost
    How to Deploy a Pharmaceutical Warehouse Environmental Monitoring System?
    University of Alberta Study Uses UbiBot WS1 Pro to Monitor Environmental Conditions in Hydroponic Lettuce Production
    Shanghai Jiao Tong University and National University of Singapore Study Use UbiBot GS1-AETH1RS for Vertical Farming Environment Monitoring
    University of Cambridge Study Uses UbiBot WS1 for Glasshouse Environment Monitoring in Chlorella vulgaris Digestate Cultivation
    How Is UbiBot Referenced in Railway Digital Twin Research?
    menu-header-svg
    Search
    • Explore Knowledge
      • Comparison & Selection
      • Industry Solution
      • Product & Device
      • Criterion & Compliance
      • Deployment & Usage
      • Technology & Principle
    • Academic Research
    • In-depth Tech

    Industry Solution

    See More >>

    How to Build a Greenhouse Environmental Monitoring System?

    Published: September 14, 2026

    Updated: September 14, 2026

    By Susan Jones

    A greenhouse can meet its central thermostat setting while crops near a cooling pad, sidewall, or shaded bench experience different conditions. That variation makes irrigation decisions harder, obscures the cause of uneven growth, and can leave overnight equipment failures unnoticed until the next inspection. Adding sensors helps only when their locations and measurements answer the grower’s operational questions.

    This guide explains how commercial growers and controlled environment agriculture teams can design a greenhouse environmental monitoring system around crop zones, root conditions, communications, and response procedures. It compares UbiBot GS1-L-A1RS with GW1 or GW1-O, Aranet PRO Plus, HOBO RX3000, and Davis EnviroMonitor IP Gateway 6805. The goal is to select a workable measurement network before committing to a platform or a large hardware order.

    Isometric greenhouse cutaway showing canopy sensors, root-zone probes, lighting zones, cooling pad, exhaust fans, and a protected gateway.

    A greenhouse monitoring plan separates crop, irrigation, lighting, and equipment zones so each measurement supports a defined decision.

    Quick Summary

    Monitor air temperature and relative humidity in representative crop zones, then add root-zone moisture and temperature, photosynthetic light, and CO₂ according to the production system. Use PAR measurements for crop-light decisions; lux alone does not establish daily light integral. A complete system combines suitable probes, local recording, a greenhouse sensor network, a gateway or station, a data platform, and tested alarms. Ethernet is useful for fixed backhaul, Wi-Fi for covered locations, cellular for remote sites, and compatible sub-GHz wireless systems for distributed sensors. RS485 can connect industrial probes when protocol and power requirements match. Compare complete installed systems, including calibration, software, ongoing service, and outage behavior. Pilot the network under real crop and irrigation conditions, then expand by independently managed zones rather than floor area alone.

    Key Takeaway

    Build the system around decisions at crop level: where conditions differ, which measurement changes an action, and who responds when a limit is crossed. UbiBot can suit expandable LoRa and RS485 monitoring, while Aranet, HOBO, and Davis offer distinct horticultural, research, and agricultural workflows. Verify probe compatibility and outage recovery before choosing among them.

    Why Is Environmental Monitoring Important in a Greenhouse?

    Commercial greenhouses contain several interacting environments. Air above a bench can differ from air within a dense canopy, while substrates supplied by the same irrigation line may dry at different rates. A grower needs enough spatial information to distinguish a local problem from a facility-wide event. A single averaged reading can conceal that distinction.

    Continuous records support crop protection and operational continuity by showing when conditions departed from the intended recipe. They also help investigate recurring differences between bays, relate irrigation events to root-zone response, and assess whether a ventilation change improved conditions. These are management benefits, not guarantees of higher yield or lower energy use.

    Humidity deserves particular attention because moisture accumulation and condensation affect greenhouse disease management. UMass Extension discusses coordinated watering, air movement, heating, and ventilation as ways to reduce humidity problems. Monitoring helps evaluate those practices; it does not diagnose pathogens or replace crop inspection. [1]

    Traceability requires context as well as measurements. Keep sensor identity, location, crop stage, maintenance, and setpoint changes alongside the time series. These records can support internal quality procedures and customer documentation. The monitoring products compared here are not presented as automatically satisfying any food-safety, occupational-safety, or regulated-crop requirement. Manual checks remain useful for verification, but cannot reconstruct every overnight excursion.

    What Environmental Parameters Should Be Monitored?

    Crop cross-section with shielded air sensor at canopy height, level PAR sensor above the canopy, and moisture probe at representative root depth.

    Air, light, and root-zone probes need different positions to measure the environment that affects the crop.

    Start with air temperature and relative humidity across independently managed crop zones. Add root-zone measurements wherever irrigation decisions depend on substrate behavior. CO₂ becomes a priority in enriched houses or when diagnosing daytime depletion. Photosynthetic light measurements are essential when the operation manages supplemental lighting, shading, or crop-specific daily light targets.

    Parameter Why it matters Monitoring location Recommended sensor type
    Essential baseline: air temperature and RH Identifies heat, cold, and moisture differences Representative canopy height in each climate zone Shielded T/RH probe suitable for the exposure
    Essential for irrigation management: substrate moisture and temperature Shows drying and root-zone differences Representative root depth in each substrate and irrigation zone Media-appropriate dielectric moisture and temperature probe
    Essential for light management: PPFD and DLI Measures crop-relevant light and daily accumulation Level, at crop height in representative lighting zones Calibrated PAR quantum sensor plus time integration
    Essential for enrichment: CO₂ Checks distribution and depletion Representative canopy air, away from direct injection CO₂ sensor with a suitable range and calibration method
    Optional: substrate EC and nutrient-solution pH Supports fertigation investigation Root zone, feed solution, or drain according to the question Probe explicitly designed for the chosen medium
    Optional: leaf temperature and wetness Adds plant-surface and moisture context Representative leaves or crop-like exposed surface IR temperature sensor or leaf-wetness sensor
    Optional: outdoor weather, flow, tank level, and equipment status Explains outside influences and utility failures Outside reference site and irrigation equipment Weather instruments, flow/level sensors, or supported status inputs

    Selection implication: prioritize measurements that change an irrigation, climate, lighting, or response decision. A longer parameter list does not automatically improve management.

    Relative humidity depends on temperature. Vapor-pressure deficit, or VPD, combines moisture and temperature information and can be more useful for interpreting evaporative demand. Air VPD calculated from air temperature and RH should be identified as such; leaf-to-air VPD needs leaf-temperature information. Michigan State University Extension explains why growers should consider VPD alongside RH. [2]

    Light units also matter. Lux describes illuminance weighted for human vision. Photosynthetic photon flux density, or PPFD, measures photon flux in the sensor’s specified photosynthetic waveband, commonly expressed as µmol m⁻² s⁻¹. Daily light integral, or DLI, accumulates that exposure in mol m⁻² d⁻¹. Purdue Extension recommends quantum sensors at plant height and emphasizes crop-specific DLI requirements. A fixed lux conversion is unsuitable across changing sunlight and LED spectra. [3]

    Moisture values require equal care. Mineral soil, peat, coir, and rockwool can need different calibration relationships. Record installation depth and position relative to the emitter. Do not interpret bulk substrate EC, pore-water EC, and feed-solution EC as interchangeable readings, or treat soil moisture percentage and soil-water tension as the same variable.

    What Does a Typical Environmental Monitoring System Include?

    The sensing layer measures the actual crop environment. A local node reads probes, applies the supported acquisition settings, and may retain records. The connectivity layer carries readings through compatible radio or wired links. A gateway or logging station provides the connection to a local network, the internet, or both.

    The platform organizes histories and users. An alarm and integration layer then delivers exceptions to people or another system. Specify who maintains each layer and where data remains available when a link fails. Cloud access reduces local server administration; an on-premises deployment adds responsibility for backups, security updates, and recovery.

    Architecture flow: Crop-zone probes → local sensing nodes → compatible wireless network → gateway → Ethernet, Wi-Fi, or cellular backhaul → cloud or on-premises platform → alarms, reports, and approved integrations.

    Architecture showing approved RS485 probes linked to GS1-L nodes, a compatible LoRa gateway, network backhaul, and alternative cloud or on-premises platforms.

     Local probe links, the wireless sensor network, gateway backhaul, and the data platform form separate parts of the monitoring path.

    For the proposed UbiBot arrangement, connect approved RS485 probes to GS1-L-A1RS nodes, then use matching regional LoRa versions with GW1 or GW1-O. On-premises access and APIs are documented platform offerings, but the exact firmware, licensing, and forwarding route should be confirmed for the ordered configuration. [4] [5] [6] [7] [8] [9]

    Keep automatic climate control within an engineered control system. Monitoring can supply evidence and integration inputs, but control requires suitable actuators, interlocks, failure states, and response timing. A cloud dashboard alone is not a greenhouse climate computer.

    Which Communication Method Should Be Used?

    Choose communications separately for the probe connection, sensor network, and internet backhaul. A LoRa node can collect an RS485 probe while its gateway uses Ethernet. Calling the whole system simply “wireless” hides these different dependencies.

    Method Suitable use Main advantage Design limitation
    Wi-Fi Covered houses and nearby service rooms Uses an existing IP network Survey coverage with mature crops, screens, and wet surfaces
    Ethernet Fixed gateway or station backhaul Predictable wired connection Requires protected cabling and powered network equipment
    4G or cellular Remote houses or independent backhaul Avoids reliance on farm broadband Check carrier, region, antenna, power, and recurring service
    LoRa or another compatible sub-GHz system Distributed low-data-rate crop sensors Reduces long sensor cable runs Match vendor protocol and regional radio version; test coverage
    RS485 Nearby industrial probes and equipment Practical wired probe interface Requires compatible protocol, addressing, electrical interface, and power

    Greenhouse plan showing survey points around mature crops, closed screens, metal structures, and a gateway with Ethernet backhaul.

     Test radio coverage with the crop, screens, and irrigation in their operating conditions before fixing gateway locations.

    Selection implication: use a mixed network when it simplifies installation. For dispersed bays with available broadband, compatible sub-GHz sensors plus an Ethernet gateway are often a sensible design starting point. Remote sites may justify cellular backhaul.

    LoRa describes radio technology; LoRaWAN defines a network protocol. UbiBot’s cited GS1-L and gateway specifications identify LoRa, not general compatibility with arbitrary LoRaWAN gateways. Similarly, Aranet uses its own sub-GHz system and Davis uses an EnviroMonitor mesh. Similar operating frequencies do not establish interoperability. [4] [5] [6]

    For US projects, order the supported US radio version. For international deployment, match both node and gateway to the destination and verify the permitted configuration. UbiBot lists several regional bands; Aranet and Davis also publish regional variants. Global frequency availability is therefore a purchasing consideration, not an exclusive UbiBot advantage. Avoid treating advertised open-air range as a greenhouse coverage guarantee.

    How Should Monitoring Products Be Compared?

    Accuracy matters only alongside measurement location, response time, exposure limits, and maintenance. An accurate sensor mounted on a sunlit frame may describe the frame’s thermal environment better than the crop’s. Compare accuracy over the actual operating range and distinguish typical performance from maximum error.

    Ask vendors to explain three failure cases separately: the node loses radio contact, the gateway loses internet access, and the site loses power. Local storage capacity does not prove that every lost radio packet can be recovered. Request an acceptance test showing which records survive, how original timestamps are preserved, and what appears on the dashboard during a stale-data condition.

    Compare the entire bill of materials: probes, shields, nodes, gateways, mounts, power supplies, installation, calibration, software, alerts, integrations, and replacement parts. Ask whether data remains exportable after a subscription ends. Also test user permissions and multi-site navigation with realistic staff roles. These details can outweigh a small difference in sensor price.

    Product and Solution Comparison

    The tables compare defined system components, not equivalent ready-made kits. “Not publicly specified” means the reviewed official material did not establish the requested detail for the selected configuration; it does not prove that the feature is unavailable. Accuracy belongs to the identified probe, not the gateway. Deployment complexity below is a design judgment; a relative cost ranking requires matched project quotes.

    Hardware and measurement comparison

    System Positioning and measured parameters Verified accuracy example Gateway and external sensors
    UbiBot GS1-L-A1RS + GW1-24FETH or GW1-24FETH-O Distributed LoRa monitoring; built-in T/RH and lux; approved external soil, CO₂, and other probes Built-in T: ±0.2°C at 0–60°C; RH: ±2% RH at 10–90% RH Dedicated compatible gateway; RS485 interface; UB-CO₂-P1 example; exact soil/PAR configuration requires confirmation. [4] [5] [6] [7]
    Aranet PRO Plus TDSBOAU3 + Aranet PRO sensors Horticultural wireless monitoring; T/RH, CO₂, PAR, plant temperature, and root-zone options TDSPC0U5 CO₂: ±(30 ppm + 3% of reading), at 0–5,000 ppm, 15–35°C, 0–80% RH Dedicated PRO Plus; separate T/RH and horticultural probes, including WET150 and PAR options.
    HOBO RX3000 RX3001-00-01 + S-THB-M002 Research-oriented station; selected smart sensors and optional analog inputs T: ±0.21°C at 0–50°C; RH: ±2.5% typical, ±3.5% maximum at 10–90% RH and 25°C, including hysteresis RX3000 is the station; optional RXMOD-A1 analog module and RXW Manager for HOBOnet expansion.
    Davis EnviroMonitor IP Gateway 6805 + Node 6810 Agricultural mesh; selected T/RH, moisture, CO₂, PAR, weather, and irrigation sensors Project probe set: Not publicly specified; select exact sensor SKUs before comparing accuracy Dedicated 6805; up to four sensors per 6810; published compatibility list includes Davis and third-party probes.

    Selection implication: Aranet and Davis offer agricultural sensor ecosystems, while HOBO supports a station-based measurement workflow. UbiBot merits evaluation where approved RS485 probes and distributed LoRa nodes meet the project’s requirements.

    The GS1-L datasheet lists an operating humidity of 10–90% RH, non-condensing, even though its built-in humidity measurement range extends further. Keep the node within its operating specification and use appropriately exposed probes. The UB-CO₂-P1 manual gives a nominal 400–10,000 ppm measurement range and a stated accuracy expression of ±(30 ppm + 3%); confirm the percentage basis and ordered revision before making direct accuracy comparisons. [4] [7]

    Connectivity and data continuity comparison

    System Network and expansion Local storage Offline data protection
    UbiBot GW1-24FETH: Ethernet/Wi-Fi; GW1-24F4G adds 4G. Outdoor GW1-24FETH-O: Ethernet/Wi-Fi; GW1-24F4G-O: Ethernet/mobile network GS1-L: 50,000 sensing records; cited GW1/GW1-O variants: 300,000 records Storage documented; exact node-to-gateway replay and full outage recovery behavior: Not publicly specified in reviewed specifications. [4] [5] [6]
    Aranet PRO Plus Ethernet/Wi-Fi; 12 sensors initially, licensed expansion to 50 or 100 Base station specification: ten years for 100 sensors Local base storage and web access; sensor-side replay after radio loss: Not publicly specified for the proposed probe set.
    HOBO RX3001 Ethernet; RX3002-00-01 Wi-Fi and RX3004-00-01 4G are separate variants RX3000: 32 MB, two million measurements Continuous station logging overwrites oldest records when full; verify recovery with the selected wired or HOBOnet configuration.
    Davis 6805 Ethernet/Wi-Fi backhaul; mesh supports up to 32 Nodes Exact capacity: Not publicly specified in reviewed documents With backup batteries, 6805 stores received records during AC loss and uploads after AC returns; uploads stop on backup operation.

    Selection implication: offline recording and live alarm delivery are separate requirements. Document the surviving measurement path and power supply for each expected outage.

    Platform and ownership comparison

    System Platform and integrations Alarms and calibration Subscription and project implications
    UbiBot Public cloud; on-premises offering; platform API and HTTP alert interaction. Confirm forwarding and multi-site permissions by edition App, email, SMS, voice, and HTTP options at platform level; charges vary. Calibration certificate scope for the selected probes: Not publicly specified Public/on-premises plans and optional services. Moderate-complexity baseline; relative total cost category: Not publicly specified without a matched quote. [8] [9] [10]
    Aranet Local web interface and Aranet Cloud; MQTT, Modbus TCP/IP, BACnet IP require integration licenses Email documented; do not assign LTE-model SMS to standard PRO Plus. CO₂ sensor has factory, manual, and automatic calibration provisions Sensor-capacity and integration licenses; obtain cloud quote. Moderate complexity; relative total cost category: Not publicly specified.
    HOBO HOBOlink cloud; REST web services with OAuth. Self-hosted HOBOlink: Not publicly specified Text/email documented; probe-specific calibration and certificate scope must be selected Paid data plan; station, probes, power, and optional modules. Moderate to higher complexity with expansion; relative total cost category: Not publicly specified.
    Davis WeatherLink/Mobilize; WeatherLink v2 API. Self-hosted WeatherLink: Not publicly specified Agricultural alarms documented; complete delivery-channel and calibration-certificate scope: Not publicly specified for the proposed package Activation and annual gateway service required. Moderate mesh installation; relative total cost category: Not publicly specified.

    Selection implication: ask for a comparable three-year quote covering the same zones and measurements. Public Davis pages show differing fees for some service intervals, so obtain current written pricing instead of carrying a single published amount into a budget. An on-premises UbiBot installation adds server ownership costs; it is not automatically the lowest-cost choice.

    Which System Is Best for Each Use Case?

    UbiBot is a reasonable candidate for growers seeking distributed monitoring with approved industrial probes and a choice of platform deployment. Its potential benefit is combining crop and facility measurements without extending Wi-Fi to every node. Whether it reduces total cost depends on compatibility work, gateway coverage, probe power, software, and the team’s support capability.

    Aranet deserves consideration when specialized horticultural measurements and a local base-station interface matter. Its published greenhouse portfolio includes plant temperature, PAR, substrate measurements, and irrigation-related instruments. HOBO RX3000 is attractive for research plots or stations that require documented logging behavior, smart sensors, and analog expansion. Davis is well suited to evaluating greenhouse conditions alongside agricultural weather and irrigation data.

    For tightly coupled climate, fertigation, and enrichment control, assess a professional greenhouse automation system and use monitoring as an independent or integrated measurement layer. Where a formal quality or compliance program applies, compare validation services, calibration documentation, access controls, and contractual support separately from basic sensor features.

    How to Build a Greenhouse Environmental Monitoring System

    Three test panels separating sensor-radio failure, gateway internet failure, and power failure, with checks for logging, alarms, and recovered timestamps.

    Test sensor-radio loss, internet loss, and power loss separately, then verify records and alarm behavior after recovery.

    Start with a small facility pilot

    Draw the crop zones, irrigation circuits, cooling pads, fans, vents, doors, and service room. For a single house, an illustrative starting survey might use three air-monitoring locations near the inlet zone, center crop zone, and far end, plus root-zone probes representing distinct irrigation or substrate conditions. This is a pilot example, not a universal minimum.

    Locate air probes at representative canopy height with appropriate radiation protection. Keep them away from direct mist, heater discharge, and structural contact unless measuring that influence deliberately. Test the network through daytime ventilation and overnight conditions. Use a supported logging interval that captures the events of interest; select the upload interval separately to meet the response requirement.

    Expand across a medium facility

    Treat each independently controlled compartment as a separate monitoring unit. Add points where crop height, lighting, exposure, or irrigation creates persistent differences. Move temporary survey sensors to resolve uncertainty before making them permanent. Replicate root-zone locations where a single container would give an unreliable picture of the irrigation zone.

    Small, medium, and multi-site greenhouse monitoring layouts with distinct crop zones and shared reporting.

    Add monitoring points as independently managed zones and meaningful environmental differences increase.

    System Platform and integrations Alarms and calibration Subscription and project implications
    UbiBot Public cloud; on-premises offering; platform API and HTTP alert interaction. Confirm forwarding and multi-site permissions by edition App, email, SMS, voice, and HTTP options at platform level; charges vary. Calibration certificate scope for the selected probes: Not publicly specified Public/on-premises plans and optional services. Moderate-complexity baseline; relative total cost category: Not publicly specified without a matched quote. [8] [9] [10]
    Aranet Local web interface and Aranet Cloud; MQTT, Modbus TCP/IP, BACnet IP require integration licenses Email documented; do not assign LTE-model SMS to standard PRO Plus. CO₂ sensor has factory, manual, and automatic calibration provisions Sensor-capacity and integration licenses; obtain cloud quote. Moderate complexity; relative total cost category: Not publicly specified.
    HOBO HOBOlink cloud; REST web services with OAuth. Self-hosted HOBOlink: Not publicly specified Text/email documented; probe-specific calibration and certificate scope must be selected Paid data plan; station, probes, power, and optional modules. Moderate to higher complexity with expansion; relative total cost category: Not publicly specified.
    Davis WeatherLink/Mobilize; WeatherLink v2 API. Self-hosted WeatherLink: Not publicly specified Agricultural alarms documented; complete delivery-channel and calibration-certificate scope: Not publicly specified for the proposed package Activation and annual gateway service required. Moderate mesh installation; relative total cost category: Not publicly specified.

    Selection implication: allocate sensors by functional differences and actionability, then remove duplication only when survey data supports it.

    Standardize a large or multi-site installation

    Use consistent identifiers such as US-Farm01-House03-ZoneB-Air01. Retain sensor serial numbers, model, calibration status, mounting height, and crop assignment. Separate viewing permissions from authority to change alarms or delete records. Keep timestamps consistent and display each site’s local time clearly.

    Commission an alarm by creating a safe test condition, measuring receipt time, and confirming acknowledgment by the assigned person. Include stale data and loss of power where supported. Test internet loss, gateway restart, and representative sensor disconnection separately; compare exported timestamps after recovery. Repeat affected checks when firmware, probe type, or network configuration changes.

    Common Design and Installation Mistakes

    1. Mounting an air probe on a sunlit greenhouse frame. Separate the sensing element from conductive surfaces and use appropriate shielding.
    2. Leaving the sensor at seedling height after the canopy grows. Review locations as crop structure changes.
    3. Calling a lux trace a DLI record. Use the correct quantum sensor and documented integration method.
    4. Placing the only CO₂ probe beside the injection outlet. Measure representative crop air and investigate distribution with additional points.
    5. Using one moisture probe for different substrates or irrigation zones. Validate placement, media response, and repeatability.
    6. Testing radio coverage only in an empty, dry house. Repeat under mature canopy, operating screens, and normal irrigation conditions.
    7. Assuming backup storage guarantees an overnight alarm. Test the power and communication path all the way to the responsible person.

    Frequently Asked Questions

    How many sensors does a commercial greenhouse need?

    The number depends on independently managed climate and irrigation zones, crop structure, and measured variability. Start with a survey that compares representative crop locations and suspected problem areas, then retain enough points to distinguish actionable differences. A sensor at each end and one in the center can be an initial air survey in a simple house, but it is not a design standard. Root-zone probes should represent the substrates and irrigation groups that require separate decisions.

    Where should temperature and humidity sensors be placed?

    Place them at representative crop-canopy height, with suitable radiation protection and airflow. Avoid direct heater discharge, mist, cooling-pad spray, and contact with structural metal unless the purpose is to investigate that particular influence. Record the height and location so that comparisons remain meaningful. As crops grow or benches move, check whether each point still represents the intended environment. Use additional temporary measurements to investigate gradients before relocating the permanent reference point.

    Can a greenhouse monitoring system work without Wi-Fi?

    Yes. Sensor nodes can use a compatible sub-GHz network, while the gateway connects through Ethernet or an appropriate cellular variant. Some systems also provide local storage or a local interface. However, operating without Wi-Fi is different from operating without internet, and both differ from surviving a power outage. Define which readings, alarms, and user interfaces must remain available in each condition, then demonstrate that behavior with the proposed hardware and software.

    Is LoRa the same as LoRaWAN for greenhouse sensors?

    No. LoRa is a radio technology, while LoRaWAN defines how a particular network operates above that radio layer. A product described as LoRa does not automatically connect to any LoRaWAN gateway. The UbiBot models reviewed here are specified as LoRa devices and should be paired with confirmed compatible gateways. Check region, protocol, firmware, and sensor support together. The same frequency label on products from two manufacturers is not evidence that they can exchange usable measurements.

    Do I need CO₂ monitoring if I do not add CO₂?

    It can still be useful when investigating ventilation or possible daytime depletion, but its priority depends on the crop, enclosure, and management question. Begin with representative canopy measurements and interpret them alongside light and ventilation activity. If enrichment is introduced, review range, calibration, placement, and distribution again. A crop-management CO₂ sensor should not be assumed to provide the separately engineered detection, interlocks, or response arrangements needed for a personnel-safety function.

    Can a lux sensor measure the light plants need?

    A lux sensor can show relative changes in illuminance, but it does not directly measure photosynthetic photon flux. For crop-light planning, specify a suitable PAR quantum sensor and integrate its readings over time to calculate DLI. The relationship between lux and PPFD changes with the light spectrum, which makes a universal conversion unreliable across sunlight and different LEDs. Keep the sensor level at crop height and follow its cleaning and calibration instructions. [3]

    Will data be lost when the internet connection fails?

    That depends on where records are stored, which equipment remains powered, and how recovery works. A station may retain data during internet loss while a disconnected wireless probe has no recoverable history. Storage also fills, and some devices overwrite older records. Test internet loss and sensor-radio loss separately. After reconnecting, compare original measurement timestamps, missing intervals, duplicates, and the time required for backfill. Confirm whether alarms during the outage are delayed, reconstructed, or unavailable.

    Can third-party soil and CO₂ probes be connected through RS485?

    Possibly, but RS485 alone does not establish compatibility. Confirm the protocol, register map, baud rate, addressing, voltage, current demand, connector wiring, and supported firmware. Check whether the node reads every required field and assigns the correct units and scaling. For GS1-L-A1RS, obtain approval for the exact probe combination and cable arrangement before purchase. Bench-test it through startup, normal sampling, and power cycling before deploying it in wet production areas.

    What should be included in the system budget?

    Include complete measurement points, shields, mounts, nodes, gateways, network equipment, backup power, installation, and commissioning. Add calibration, probe replacement, batteries, cellular service, platform subscriptions, alert usage, and integration maintenance over a common ownership period. If comparing an on-premises system, include server administration and backups. Ask vendors to quote the same number of zones and the same measurements. A low gateway price says little about the final cost of a working, maintainable installation.

    Conclusion and Selection Recommendations

    Begin with the crop and the decisions that require better evidence. Map environmental differences, select suitable probes, and verify communications and outage behavior in a pilot. Expand only after the data and alarm workflow prove useful to the people managing production.

    UbiBot GS1-L-A1RS with a suitable GW1 or GW1-O can provide a balanced monitoring option when approved probe expansion, distributed wireless coverage, and platform flexibility match the project. Aranet, HOBO, and Davis remain credible choices for their respective horticultural, research, and agricultural workflows. Request a matched configuration and acceptance test from each shortlisted supplier. For automatic control or formal validation requirements, evaluate the necessary specialist system and services alongside the monitoring network.

    Sources and Product Information Disclaimer

    Specifications and services vary by model, region, probe, firmware, software edition, and subscription. Sources below were reviewed on September 14, 2026; older official manuals are identified by document title or revision where available. Confirm the current orderable configuration and regional availability before procurement. Recommendations are engineering judgments for planning, not tested comparative performance claims. No system-level regulatory certification, yield improvement, or cost saving is implied.

    Official Sources

    These sources support the article and all three product comparison tables. Each numbered reference in the article links directly to its official source. Review date September 14, 2026.

    1  UMass Extension — Reducing Humidity in the Greenhouse

    Humidity management guidance; search-indexed official text reviewed.

    2  Michigan State University Extension — Why greenhouse growers should consider vapor-pressure deficit

    VPD guidance; official search result and extension publication identified.

    3  Purdue Extension — Measuring Daily Light Integral HO 238 B W

    DLI, crop dependence, quantum sensor placement and care.

    4  UbiBot — GS1-L specifications

    GS1-L-A1RS accuracy, memory, operating conditions, bands, and external probe categories.

    5  UbiBot — GW1 specifications

    GW1-24FETH and GW1-24F4G backhaul, power, memory, and regional bands.

    6  UbiBot — GW1-O specifications

    GW1-24FETH-O and GW1-24F4G-O interfaces, IP65 rating, and memory; interfaces differ by model.

    7  UbiBot — UB-CO₂ user guide version 1.3

    UB-CO₂-P1/P2/P3 measurement specifications, RS485 Modbus RTU, and power requirements.

    8  UbiBot — Pricing Overview and On-Premises App Center

    Public platform, on-premises platform, and developer offerings. Detailed on-premises plans: Open official page

    9  UbiBot — Platform API Quick Start and Limits

    API availability and limits; exact project entitlements require confirmation.

    10  UbiBot — Alerts

    Platform notification channels, HTTP interaction, and paid message options; not proof of offline local alarm behavior.

    分享

    LinkedIn2

    Facebook2

    X

    Newsletter Signup

    Related Resources

    What Is an Environmental Monitoring System and How Does It Work?
    UbiBot vs Eupry vs Dickson vs ELPRO: Which Remote Temperature Monitoring System Fits Your Site?
    How to Build a Multi-Site Environmental Monitoring System: Sensors, Gateways, Audit Trails and Total Cost
    How to Deploy a Pharmaceutical Warehouse Environmental Monitoring System?
    University of Alberta Study Uses UbiBot WS1 Pro to Monitor Environmental Conditions in Hydroponic Lettuce Production
    Shanghai Jiao Tong University and National University of Singapore Study Use UbiBot GS1-AETH1RS for Vertical Farming Environment Monitoring
    University of Cambridge Study Uses UbiBot WS1 for Glasshouse Environment Monitoring in Chlorella vulgaris Digestate Cultivation
    How Is UbiBot Referenced in Railway Digital Twin Research?
    menu-header-svg
    Search
    • Explore Knowledge
      • Comparison & Selection
      • Industry Solution
      • Product & Device
      • Criterion & Compliance
      • Deployment & Usage
      • Technology & Principle
    • Academic Research
    • In-depth Tech
    Enter Your Information

    Confirm

    Products

    Dashboards

    Support

    Purchase

    Company

    Smart Sensing

    UbiBot Web Console

    APP Download

    UbiBot Online Store

    News

    Smart Control

    UbiBot Space

    Product Docs & APIs

    Find Distributors

    Learn Hub

    Smart Video

    UbiBot On-Premises

    Helpdesk & FAQ

    Volume Pricing

    About Us

    LoRa Products

    Agency Web Console

    Video Center

    Contact Us

    Software & Platform


    Pricing


    Architecture

    External Sensors


    System Status

    Accessories


    Become a Distributor

    Global SIM


    Become an Affiliate

    Positioning System


    Products

    Dashboards

    Business Partners

    WS1

    UbiBot Web Console

    Volume Pricing

    WS1 Pro

    UbiBot Space

    Become a Distributor

    GS1

    UbiBot Support Desk

    Affiliates

    GS2

    Agency Web Console


    MS1


    SP1


    Accessories


    Docs

    Purchase

    Company

    Platform API

    Pricing

    News

    Q&A

    UbiBot Partners

    About us

    Privacy Policy

    Online Store

    Contact

    Terms of Service


    System Status

    Products

    Dashboards

    Smart Sensing

    UbiBot Web Console

    Smart Control

    UbiBot Space

    Smart Video

    UbiBot On-Premises

    LoRa Products

    Agency Web Console

    Software & Platform


    External Sensors


    Accessories


    Global SIM


    Positioning System


    Support

    Purchase

    APP Download

    UbiBot Online Store

    Product Docs & APIs

    Find Distributors

    Helpdesk & FAQ

    Volume Pricing

    Video Center


    Pricing


    Company

    News

    Learn Hub

    About Us

    Contact Us

    Architecture

    System Status

    Become a Distributor

    Become an Affiliate

    Language:
    English 日本語 (ベータ)  
    Language:

    English

    日本語 (ベータ)


    IoT Product Family:
    ubibotico     Wireless environmental sensing products and smart building solutions
    ubitrackico     UWB-based real-time indoor tracking solutions with 30cm accuracy

    IoT Product Family:

    ubibotico  Wireless environmental sensing products and smart building solutions
    ubitrackico  UWB-based real-time indoor tracking solutions with 30cm accuracy

    © 2013-2026 UbiBot.com. All rights reserved.

    Terms of Service | Privacy Policy | Compliance

    youtube facebook twitter